How Apache Flink™ Enables New Streaming Applications, Part 1
(For the rest of this series, see part 2 here and part 3 here)
Stream data processing is booming in popularity, as it promises better insights from fresher data, as well as a radically simplified pipeline from data ingestion to analytics. Data production in the real world has always been a continuous process (for example, web server logs, user activity in mobile applications, database transactions, or sensor readings). As has been noted by others, until now, most pieces of the data infrastructure stack were built with the underlying assumption that data is finite and static.
To bridge this fundamental gap between continuous data production and the limitations of older “batch” systems, companies have been introducing complex and fragile end-to-end pipelines. Modern data streaming technology alleviates the need for complex solutions by modeling and processing data in the form that it is produced, a stream of real-world events.
The idea of modeling and processing data as streams is, of course, not new, nor is the availability of data stream processors in the market. However, a new breed of streaming systems (including Apache Flink™) offers a qualitative difference from older stream processing systems, both open source and proprietary. Data streaming with Flink is much broader than the traditional notion of faster (real-time) analytics, encompassing also analytics on historical data, as well as enabling a new class of applications that were very hard or simply not possible with older technologies. In this series of blog posts, we examine some of these applications in detail, and show how and why Flink can support these efficiently:
-
Accurate results for out of order data. In most stream processing scenarios the order of events matter, and typically the order in which the events arrive at the data processing cluster is different from the time that these events actually happened in the real world. Flink is the first open source system that gives developers control over event time, the time that things actually happened, enabling accurate results on out of order streams.
-
Sessions and unaligned windows: Analytics on web logs, machine logs, and other data need the ability to group events in a session, a period of activity surrounded by a period of inactivity. A session is a typical example of unaligned windows, i.e., windows that start and end differently for each key, which need the separation between windowing and checkpointing that Flink offers.
-
Versioning application state: In a pure data streaming architecture (often called Kappa Architecture), streams are persistent logs of events, and applications work with state computed from the stream. In such an architecture, Flink’s distributed snapshots can be used to “version” application state: Applications can be upgraded without loss of transient state, application state can be rolled back to previous versions (upon discovery and correction of a bug, for example), or a different variant of an application can be forked off a certain state (for example for A/B testing).
-
Time travel: With event time and durable streams, the very same streaming program can be used to compute real-time statistics over incoming events, to compute offline statistics over historic data, or to start the program on historic data (warm up of models) before it naturally becomes a real-time program once it catches up with the events as they are received.
This blog post covers the first use case (accurate results for out of order data streams), and the next posts in the series cover the remaining use cases.
Out of order streams and event time windows
Before talking about handling out-of-order streams we need to define order, and thus time. There are two notions of time in streaming:
- Event time is the time that an event happened in the real world, usually encoded by a timestamp attached to the data record that the event emits. In virtually all data streams, the events carry timestamps that define when the event was created: Web server logs, events from monitoring agents, mobile application logs, environmental sensor data, etc.
- Processing time is the time measured by a machine that processes the event. Processing time is measured simply by the clock of the machines that run the stream processing application.
In many stream processing setups, there is a variable lag between the time that an event is produced by an application (server log, sensor, monitoring agent, …) and the time it arrives in the message queue for processing. The reasons for that are manyfold:
- Varying delays on different network paths
- Queuing and backpressure effects from the stream consumers (logs or transactional stores)
- Data rate spikes
- Some event producers that are not always connected (mobile devices, sensors, etc)
- Some producers that emit their events in bursts
The end effect of this is that events are frequently “out of order” in the queue with respect to their event time. Furthermore, the difference between the event’s creation timestamp and the time when the event reaches the queue or stream processor changes over time. This is is often referred to as event time skew and is defined as “processing time - event time”.
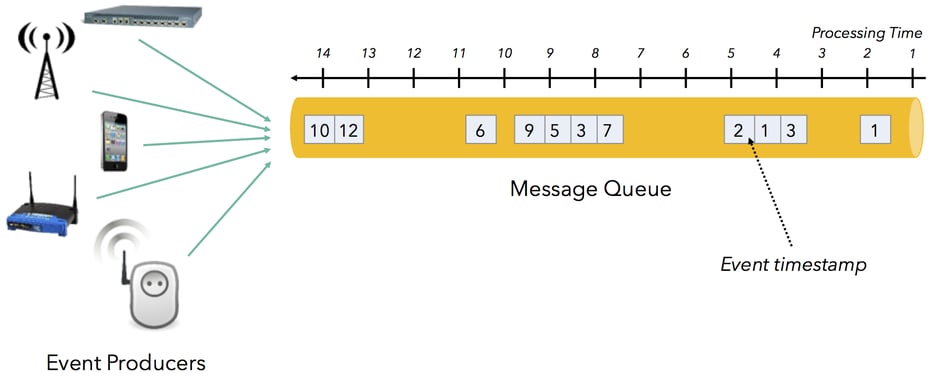
For many analytical application, analyzing events with respect to their creation timestamp (i.e., by event time) yields by far the most interesting results, compared to analyzing them with respect to the time when they arrive in the message queue or streaming system:
- Correlating events from environmental sensors or monitoring systems (looking for co-occurring patterns) gives only meaningful results when treating events as simultaneous if they were produced simultaneously.
- Computing statistics over event occurrence (for example signals per minute) is inherently inaccurate unless referring to event time.
- Detecting patterns in sequences of events requires a meaningful order of events, usually order of occurrence, not order of arrival.
Flink allows users to define windows over event time, rather than over processing time. As a result, windows are not susceptible to out-of-order events and varying event time skew. They compute meaningful results respecting the time inherent to the events. Flink tracks event time using an event time clock, implemented with watermarks. Watermarks are special events generated at Flink’s stream sources that coarsely advance event time. A watermark for time T states that event time has progressed to T in that particular stream (or partition), meaning that no events with a timestamp smaller than T can arrive any more. All Flink operators can track event time based on this clock. The next section dives more deeply into the notions of watermarks and how Flink measures event time. The illustration below shows how Flink computes windows on event time. The central observation is that there is not one window that moves over the stream, but possibly many concurrent windows are in progress, to which events are assigned based on the event timestamp. Window computation is triggered when watermarks arrive and update the event time clock.
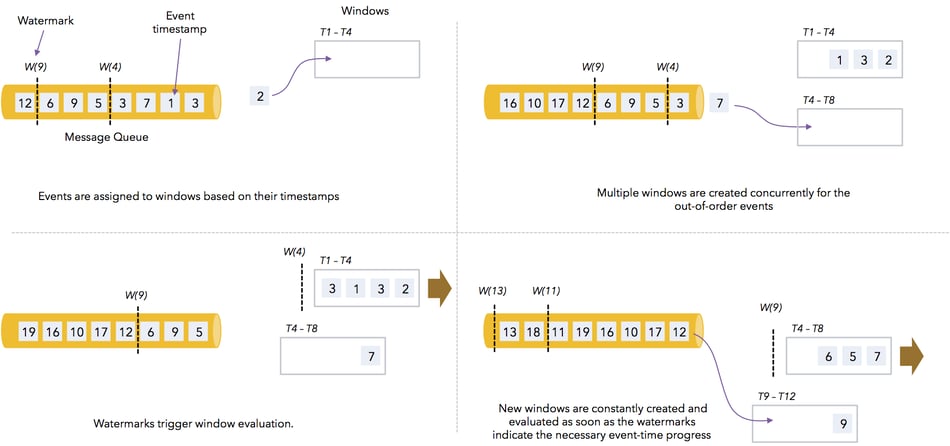
Pipelines based on event time produce accurate results as soon as possible (once the event time has reached the necessary time) but as late as necessary (to include the relevant events). Compared to periodically computing the aggregates with batch processors, streaming event time pipelines produce results earlier and often more accurate (as batch pipelines cannot properly model out-of-order events that cross batches). Finally, the streaming job describes simply and explicitly how to group elements by time (windowing), and how to assess the necessary progress in time (watermarks), rather than spreading that logic across (1) a rolling ingestion into files, (2) a batch job, and (3) a periodic job scheduler.
Combining event time and real-time pipelines
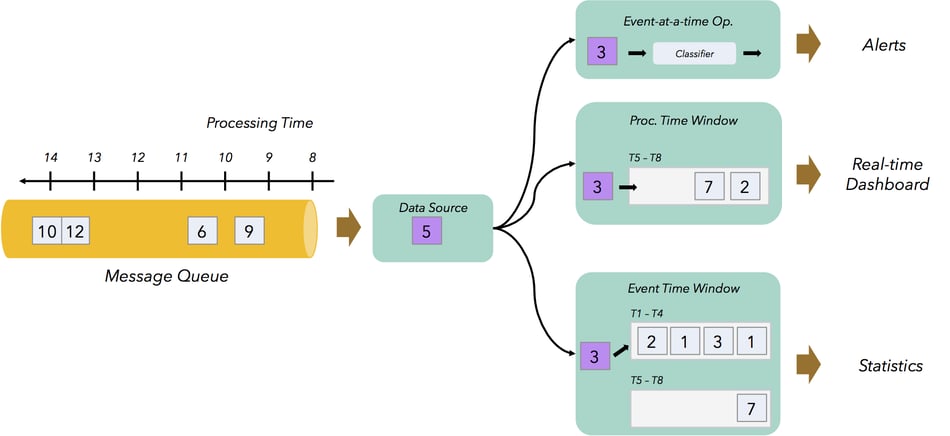
Event time pipelines produce results with a certain delay, as they wait for the required event time progress. In some cases, that delay is too large to produce proper real-time results. In such cases, event time pipelines replace offline batch jobs, or add accurate short-lagtime results to an application. Because Flink is a proper stream processor that can process events within milliseconds, it is easily possible to combine low latency real-time pipelines with event time pipelines in the same program. The example below illustrates a program that produces
- Low-latency alerting, based on individual events. If an event of a certain type is discovered, an alert message is sent.
- A real time dashboard based on processing time windows that aggregate and count the events, every few seconds.
- Accurate statistics based on event time.
// create environment and configure it
val env: StreamExecutionEnvironment = StreamExecutionEnvironment.getExecutionEnvironment

env.setParallelism(4)
env.setStreamTimeCharacteristic(TimeCharacteristic.EventTime)

// create a stream of sensor readings, assign timestamps, and create watermarks
val readings: DataStream[SensorReading] =
env.addSource(new SampleDataGenerator())
.assignTimestamps(new ReadingsTimestampAssigner())

// path (1) - low latency event-at a time filter
readings
.filter(_.reading > 100.0)

.map("-- ALERT -- Reading above threshold: " + _.reading)
.print()

// path (2) - processing time windows: Compute max readings per sensor group
// because the default stream time is set to Event Time, we override the trigger with a
// processing time trigger

readings
.keyBy(_.sensorGroup)
.window(TumblingTimeWindows.of(Time.seconds(5)))
.trigger(ProcessingTimeTrigger.create)
.fold(Statistic("", 0L, 0.0), (curr: Statistic, next: SensorReading) => {
Statistic(next.sensorGroup, next.timestamp, max(curr.value, next.reading))
})

.map("PROC TIME - max for " + _)
.print()

// path (3) - event time windows: Compute average reading over sensors per minute
// we use a WindowFunction here, to illustrate how to get access to the window object
// that contains bounds, etc.
// Pre-aggregation is possible by adding a pre-aggregator ReduceFunction

readings
.keyBy(_.sensorId)
.timeWindow(Time.minutes(1), Time.seconds(10))
.apply(new WindowFunction[SensorReading, Statistic, String, TimeWindow]()
(The full code for this example can be found here.)
Another way of combining event time and processing time is to define event time windows with early results, or with a maximum lag:
- Event time windows can be customized to have a maximum lag behind processing time. For example, an event time window that would close as 10:15h in event time could be customized to close no later than 10:20h in processing time.
- Event time windows can emit early results. For example, a program that counts the number of events in sliding 15 minute event time windows, could emit the current count of every pending window every minute in processing time.
To implement such methods, Flink offers window triggers. These triggers define conditions when the window should be evaluated. Triggers can react to the processing time clock, the event time clock, or even to contents of the data stream. We will dive into the power of triggers in a follow-up blog post.
How Flink measures time
Now, we dig a bit deeper into the mechanisms that Flink uses to handle time, and how these are different from older streaming systems. Time, in general, is measured using a clock. The simplest clock (called wall clock) is the internal clock of a machine which is part of the cluster that is executing a streaming job. Wall clocks keep track of processing time. To keep track of event time, we need a clock that will measure the same time among machines. This is done in Flink via the watermark mechanism. A watermark is a special event signaling that time in the event stream (i.e., the real-world timestamps in the event stream) has reached a certain point (say, 10am), and thus no event with timestamp earlier than 10am will arrive from now on. These watermarks are part of the data stream alongside regular events, and a Flink operator advances its event time clock to 10am once it has received a 10am watermark from all its upstream operations/sources. Note that an event time clock tracks time more coarsely than a wall clock, but is more correct, as it is consistent across machines. A third type of clock (which we will call system clock) is used by stream processing systems for their internal bookkeeping, most prominently to guarantee consistent semantics (“exactly-once processing”). Flink tracks the progress of a job by injecting barriers to the data stream and drawing consistent snapshots of the computation. Barriers are similar to watermarks in that they are events that flow through the stream. The difference is that barriers are not generated by the real world sources, but by Flink’s master at intervals measured by the wall clock of the master. Similarly, Spark Streaming schedules micro-batches based on the wall clock of Spark’s receiver. Both Flink’s mechanism for snapshotting and Spark’s micro-batch mechanism are examples of a system clock, a way to track time (and thus progress) of the computation. The picture shows how different clocks can measure different times if we “freeze” the computation.
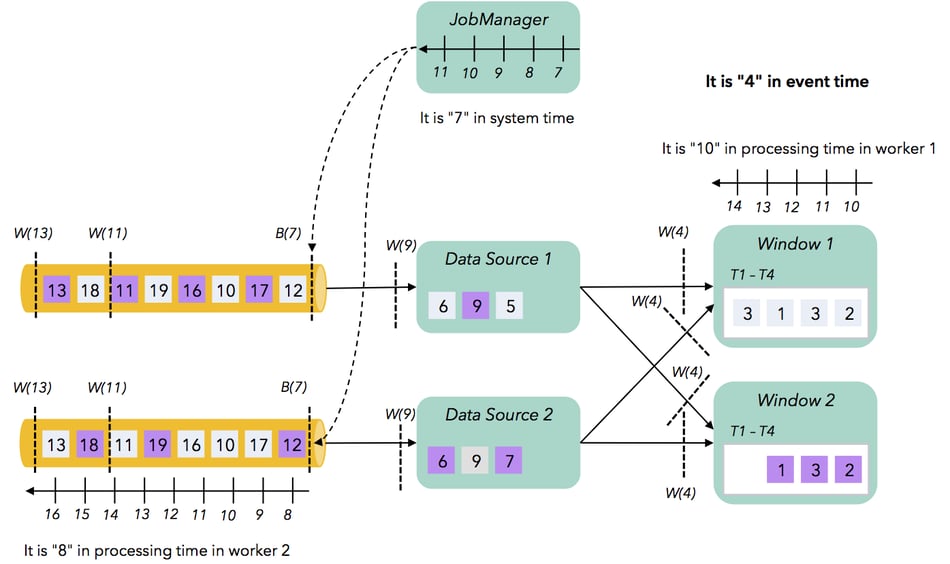
The job consists of a data source and a window operator that are executed in parallel in two machines (worker 1 and worker 2). The number in the events represents their timestamp, and the color of their boxes represents their key value (grey events go to window 1, and purple events go to window 2). The data source reads events from the queue (which is also partitioned), and partitions them by key, routing them to the correct window operator instance. The window is defined as a time window on event time. We see that the wall clocks of different machines (worker 1, worker 2, and master), may be measuring a different time (10, 8, and 7 respectively - assume that time starts from 0) due to lack of synchronization.
The sources emit watermarks, and currently all watermarks with timestamp 4 have arrived at the window operators. This means that the event time clock measures 4, and this time is consistent across the parallel computation.
Finally, the master (JobManager) is currently injecting barriers at the sources to take a snapshot of the computation. This means that the system time measures 7 (this can be the 7th checkpoint so far, or a timestamp injected based on the processing time of the master). So, we have seen that there are three clocks in stream processing scenarios:
- The event time clock (coarsely) measures the time in the event stream
- The system clock measures the progress of the computation and is used by the system internally for providing consistent results in the case of failures among other usages. This clock is, really, based on the wall clock of the coordinating machine.
- The wall clock of a machine measures processing time.
A common pitfall of older systems is that all three clocks are identical; the same clock is used to measure time in the real world, as well as track the progress of the computation. This results in two problems:
- The results of the computation are not correct: Since the order that events happen in the real world is different than the order that they are ingested or processed, the system groups events in the wrong time windows.
- The results of the computation depend on the current time, e.g. the day that the stream processing job actually starts, and the time that happens to me measured by the machines.
- System configuration parameters can influence the semantics of the programs: When increasing the checkpointing interval, e.g., to increase throughput, windows buffer more elements.
These shortcomings of older streaming systems make it very hard to use them for applications that need accurate (or at least controllably accurate) results as well as in applications that need to process both historical and real time data. Together with the comparatively low throughput of earlier streaming systems, that gave streaming technologies a “bad rep”: Heavy and accurate processing was perceived to be only possible with batch processors, while streaming systems only added some fast approximate results, e.g., as part of a Lambda Architecture. What is new in Flink is that it completely separates these three clocks:
- An event time clock based on watermarks tracks event stream time, and allows users to define windows based on event time. These windows close when the system knows that no further events for that window will arrive. For example, a time window from 10:00h to 10:15h will be closed when the system knows that the event time in the stream has progressed to at least 10:15h.
- A system clock that is completely decoupled from the event time clock tracks progress of computation and times global snapshots. This clock is not surfaced to the user API, but used to coordinate distributed consistency.
- The wall clocks of the machines (processing time) are exposed to the user in order to support processing time windows and augment event-time windows with early, approximate results.
This separation of clocks and time progress makes Flink capable of much more than older “real-time” streaming systems. Real time results is just one of the use cases for stream processing with Flink (and hence the support for processing time). With event time, the stream processor can become the “workhorse” for all analytics, including applications that need accurate results despite the arrival order of the stream, as well as analytics on historical data by stream replay, completely obviating the need for a batch processor.
Conclusion
In this blog post, we saw how
- Flink provides window operators that evaluate when event time (i.e., time in the real world) advances, rather than when the wall clock time of the machines advances, resulting in accurate results even when streams are out of order or events are delayed.
- Flink can combine these event time operators with triggers for early results, and low latency alerts.
- Flink separates its internal system clock that tracks the checkpointing progress from the clock that tracks event time, which is the necessary to enable such applications
Accurate results on delayed- and out of order streams, and histories streams is a crucial prerequisite for using stream processors for serious applications, and replacing batch infrastructure with streaming infrastructure. However, it is only one of the new applications enabled by modern streaming systems like Flink. Stay tuned (and follow our Twitter account) for the next blog posts in this series that will examine other applications enabled by Apache Flink™ such as sessions, time travel, application state versioning, or dealing with very large state.

You may also like
Preventing Blackouts: Real-Time Data Processing for Millisecond-Level Fault Handling
Leverage real-time data processing for instant power outage detection. Im...

Real-Time Fraud Detection Using Complex Event Processing
Real-time fraud detection with Complex Event Processing helps identify su...

Meet the Flink Forward Program Committee: A Q&A with Erik Schmiegelow
Discover insights from Erik Schmiegelow of Hivemind on the importance of ...

Meet the Flink Forward Program Committee: A Q&A with Yuan Mei
Discover Yuan Mei's insights on streaming data, state management, and the...


