Real-time Experiment Analytics at Pinterest using Apache Flink
This post originally appeared on the Pinterest Engineering Blog on Medium. It was reproduced here with permission from the authors.
At Pinterest, we run thousands of experiments every day. We mostly rely on daily experiment metrics to evaluate experiment performance. The daily pipelines can take 10+ hours to run and sometimes are delayed, which has created some inconvenience in verifying the setup of the experiment, the correctness of triggering, and the expected performance of the experiment. This is especially a problem when there is some bug in the code. Sometimes it may take several days to catch that, which has caused bigger damage to user experience as well as top line metrics. We developed a near real-time experimentation platform at Pinterest to have fresher experiment metrics to help us catch these issues as soon as possible. Some examples of issues that may come up are:
-
An experiment causes a statistically significant drop in impressions and needs to be shut down as soon as possible.
-
An experiment has resulted in a significant gain in number of searches performed with regards to the control group.
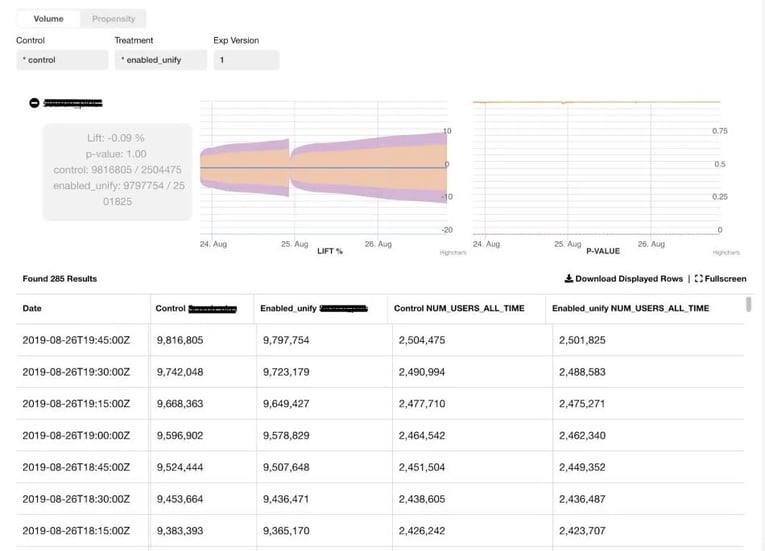 Fig 1 - Real-time experiment metrics with confidence intervals
The dashboard above shows the volume (i.e number of actions) and propensity (i.e number of unique users) of the control and treatment groups of an experiment for a selected event. The counts are aggregated for 3 days since the launch of the experiment. If a re-ramp (increase in user allocation of control and treatment groups) occurs after the 3 days, the counts start accumulating again from zero for another 3 days.
In order to make sure that the results and comparisons between control and treatment are statistically valid, we perform several statistical tests. Since metrics are delivered in real time, we have to do these tests every time a new record is received in a sequential fashion. This requires different methods from traditional fixed horizon tests otherwise it will bring high false positive rate. Several sequential testing methods have been considered including Gambler’s Ruin , Bayesian A/B test and Alpha-Spending Method. For the sake of numerical stability, we started from t-test + Boferroni Correction (treat our case as multiple testing) with the number of tests pre-determined for our initial implementation.
High Level Design
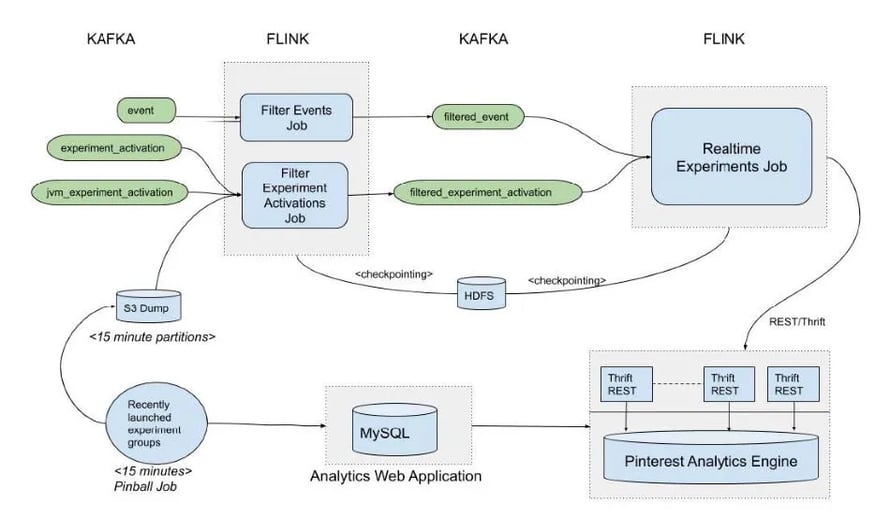 Fig 2 - A high level design of the realtime experiments pipeline
The realtime experimentation pipeline consists of the following main components:
-
Recently ramped experiment groups job → Publishes a CSV file every 5 minutes to an S3 location. The CSV is a snapshot of the experiment groups that had an increase in user allocation in the past 3 days. This information is obtained by querying the MySQL database of an internal Analytics application that hosts experiment metadata.
-
Filter Events Job → We analyze hundreds of user actions at Pinterest. This job keeps only the most business critical events, which are inserted into the ‘filtered_events’ Kafka topic. These events are stripped off fields that are not needed, so the filtered_events topic is fairly lightweight. The job runs in Flink processing time and its progress is saved via Flink’s incremental checkpointing to HDFS every 5 seconds.
-
Filter Experiment Activations Job → Whenever a user gets triggered into an experiment, an activation record gets created. Triggering rules depend upon experiment logic and a user can be triggered into an experiment hundreds of times. We only need activations of experiments that launched or had an increase in group allocation in the last 3 days.
To filter the activations, this job uses Flink’s Broadcast State pattern. The CSV published by the ‘recently ramped experiment groups’ job is checked every 10 seconds for changes and published to every partition of a KeyedBroadcastProcessFunction that also consumes activations.
By joining the broadcasted CSV with activation stream, the KeyedBroadcastProcessFunction filters out those activation records for experiments that are not ramped up within the last 3 days. Additionally, the ‘group-ramp-up-time’ is added to the activation record and it is inserted into the ‘filtered_experiment_activations’ kafka topic.
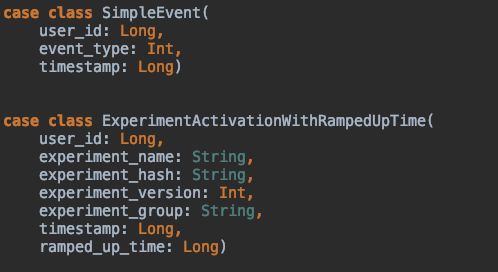 Fig 3 - Scala objects inserted into intermediate Kafka topics
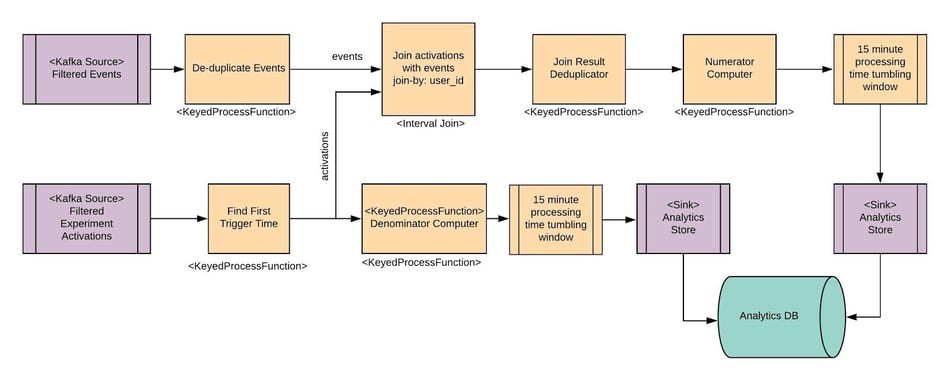 Fig 4 - Diagram of Real-time Experiment Aggregation Job
Above is a high level overview of the real time aggregation Flink job. Some of the operators are covered here briefly, while some are described in detail in later sections. The source operators read data from Kafka, while the sinks write to our internal Analytics store using a REST interface.
De-duplicate Events → This is implemented as a KeyedProcessFunction that is keyed by (event.user_id, event.event_type, event.timestamp). The idea is that if events from the same user for the same event-type have the same timestamps, they are duplicate events. The first such event is sent downstream but is also cached in state for 5 minutes. Any subsequent events are discarded. After 5 minutes, a timer runs and clears the state. The assumption is that all duplicate events are within 5 minutes of each other.
Find First Trigger Time → This is a Flink KeyedProcessFunction, keyed by (experiment_hash, experiment_group, user_id). The assumption is that the first experiment activation record received for a user is also the activation with the first trigger time. The first activation received is sent downstream and saved as state for the next 3 days since an experiment ramp-up (we aggregate counts for 3 days since experiment group got ramped up). A timer clears the state after 3 days of ramp time.
15 minute processing time tumbling windows → Both Numerator Computer and Denominator computer aggregate counts when events come in and send results downstream. These are millions of records, but we don’t need to send results so frequently to the Analytics store. We accomplish this more efficiently by having a 15 minute Flink tumbling window that runs on processing time. In the case of Numerator Computer, this window is keyed by ("experiment_hash", "experiment_group", "event_type", "timestamp"). When the window fires after 15 minutes, the record with the max_users is taken and sent downstream the Analytics Store sink.
Join Activations with Events
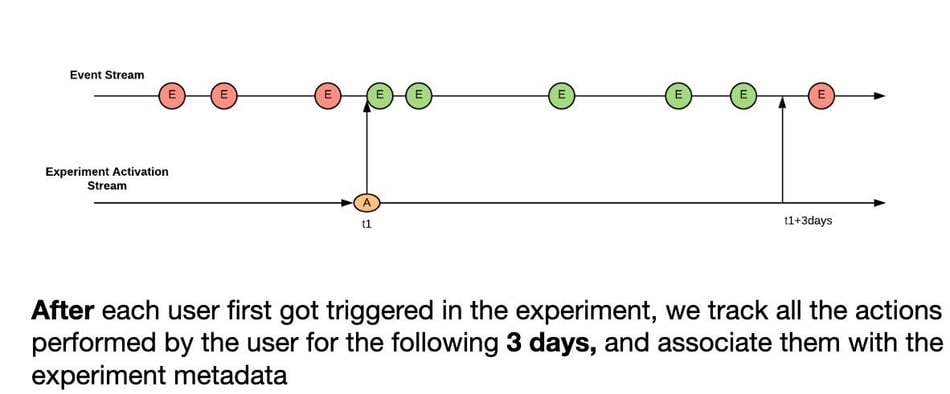 Fig 5 - Join activations stream with events stream by user-id
We implement the stream-stream join with Flink’s IntervalJoin operator. IntervalJoin buffers the single activation record per user for the next 3 days and all matching events are sent downstream with additional experiment metadata from the activation record.
Limitations with this approach
-
The IntervalJoin operator is a little inflexible for our requirements, because the interval is fixed and not dynamic. So a user might join the experiment 2 days after launch but the IntervalJoin will still run for the user for 3 days, i.e 2 days after we stop aggregating data. It’s also possible to have 2 such joins for a user if the groups got re-ramped soon after 3 days. This situation is handled downstream.
-
Events and activations becoming out of sync: If the activations job fails and activations stream gets delayed, it’s possible to have some data loss since events will still be flowing without match activations. This will result in undercounting.
We’ve looked into Flink’s IntervalJoin source code. It does buffer activations for 3 days into a ‘left-buffer’. However, events will be deleted immediately. Currently, it looks like there is no way to change this behaviour via configuration. We are looking into implementing this activation-event join using Flink’s coprocess function, which is a more general purpose function for stream-stream joins. We can buffer events for X minutes so that even if activation stream get delayed for X minutes, the pipeline can handle the delay without undercounting. This will help us avoid double joins for the same user and can result in a more dynamic pipeline that is immediately aware of re-ramps of experiment groups and support more dynamic behaviour like automatic extension of coverage of aggregations in case of re-ramps of groups.
Join Results Deduplicator
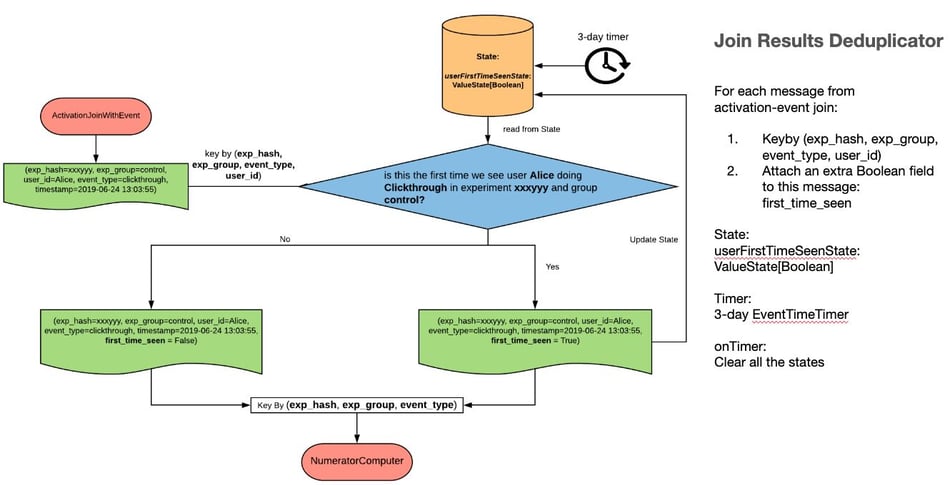
Fig 6 - Join Results Deduplicator
The Join Results Deduplicator is a Flink KeyedProcessFunction that is keyed by experiment_hash, experiment_group, event_type, user_id. The primary purpose of this operator is to insert a ‘user_first_time_seen’ flag when sending records downstream - this flag is used by the downstream Numerator Computer to compute propensity numbers (# unique users) without using a set data structure.
This operator stores state till the last-ramp-time + 3 days, after which the state is cleared.
Numerator Computer
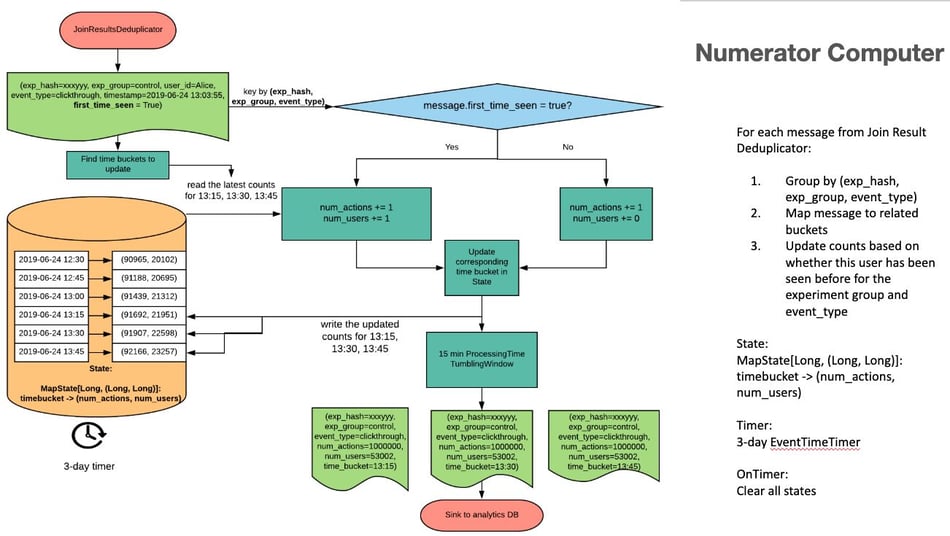
Fig 7 - Numerator Computer
The Numerator Computer is a KeyedProcessFunction that is keyed by experiment_hash, experiment_group, event_type. It maintains rolling 15 minute buckets for the last 2 hours, which are updated every time a new record comes in. For volume, every action counts, so for every event, action counts are incremented. For propensity numbers (unique users) - it depends upon the ‘first_time_seen’ flag (increment only if true).
The buckets roll/rotate as time passes.The buckets data is flushed downstream to the 15 minute tumbling windows every time a new event comes in.
It has a 3 day timer (from ramp-time → 3 days) that clears all state upon firing effectively resetting/clearing counts to zero after 3 days since ramp-up.
Spammers & Capping
In order to make our streaming pipeline fault-tolerant, Flink’s incremental checkpoint & RocksDB statebackend were used for saving application checkpoints. One of the interesting challenges we faced was checkpoint failure. The issue appeared to be that checkpointing process takes an extremely long time and it eventually reaches timeout. We also noticed that typically when checkpoint failure happens, there is also high back-pressure.

Fig 8 - checkpoint failure shown in Flink UI
After taking a closer look inside the checkpoint failure, we found that the timeout was caused by some subtasks not sending acknowledgment to the checkpoint coordinator and the whole checkpoint process was stuck, as shown below.
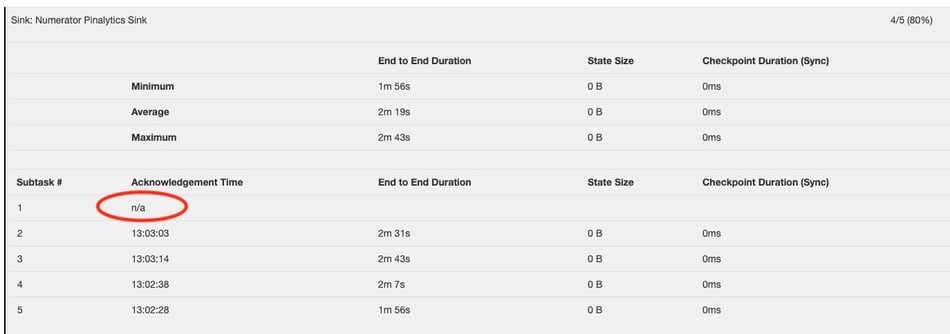 Fig 9- Subtask not sending acknowledgement
Several debugging steps were then applied to root cause the failure:
-
Check job manager log
-
Check the task manager log of the subtask which got stuck during checkpointing
-
Use Jstack to take a detailed look at the subtask
It turned out the subtask was functioning normally and it was just too busy processing messages. As a result, this specific subtask had high back-pressure which prevented barriers flowing through. Without recipient of barriers, checkpoint process could not move forward.
After further checking Flink metrics for all subtasks, we found that one of them was producing 100x more messages than its peers. Since messages were partitioned by user_id across subtasks, this indicates that there are some users producing much more messages than others, and that leads to a conclusion of spamming. This result was also confirmed by adhoc querying our spam_adjusted data sets.
 Fig 10 - number of messages for different subtasks
In order to mitigate the problem, we applied a capping rule in Filter Events Job: if for a user within one hour, we see more than X messages, we only send the first X messages. We were glad to see there was no checkpoint failure anymore after we applied the capping rule.
Data Robustness and Validation
Data accuracy could not be more important for computing experiment metrics. In order to ensure our real time experiment pipeline behaves as expected and always delivers accurate metrics, we launched a separate daily workflow that performs the same computation as the streaming jobs does, but in an ad-hoc way. Developers will be alerted if the streaming job results violate any of the following conditions:
-
Counts should be non-decreasing within the same aggregation period (3 days in our case)
-
If there is a re-rampup after the first aggregation period, counts should start accumulating from 0 for another 3 days.
-
The discrepancy between streaming results and validation workflow results should not exceed a certain threshold (2% in our case).
By querying experiment metadata, we run the validation on experiments under 3 cases respectively:
-
Experiments with single ramp-up
-
Experiments with multiple ramp-ups within the initial aggregation period
-
Experiments with multiple ramp-ups after the initial aggregation period
This workflow can be visualized as below.
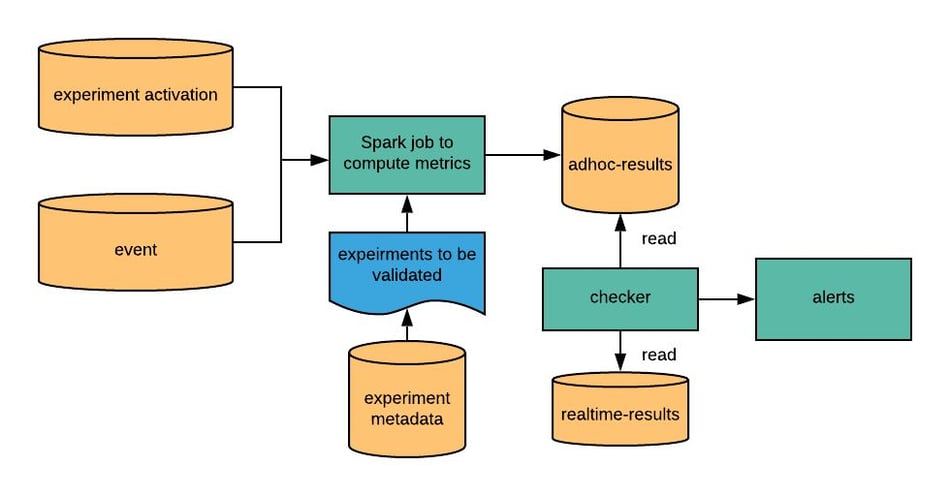 Fig 11 - Validation workflow
Scale
In this section we present some basic stats to show the scale of real-time experiment pipeline:
-
Input topic volume (average over one day):
Kafka topic name messages/sec MB/sec experiment_activation 2,513,006.863 1,873.295 event 127,347.091 64.704 filted_experiment_activation 876,906.711 88.237 filtered_backend_event 9,478.253 0.768 -
100G checkpoint
-
200~300 experiment groups
-
8 masters, 50 workers with each being ec2 c5d.9xlarge
-
Computation is done with number of parallelism = 256
Future Plans
-
Support more metrics like PWT (pinner wait time), so that if an experiment causes an unusual increase in latency for pinners, it can be stopped asap.
-
Potentially update the pipeline to use Flink’s coprocess function instead of Interval Join to make the pipeline more dynamic and resilient to out-of-sync issues between event and activation streams.
-
Segmentation: Look into what kind of segments can be supported, since segmentation causes an increase in state.
-
Support real time alerts via email or Slack.
Acknowledgements
Real-time Experiment Analytics is the first Flink-based application in production at Pinterest. Huge thanks to our Big Data Platform team (special thanks to Steven Bairos-Novak, Jooseong Kim, and Ang Zhang) for building out the Flink platform and provide it as a service. Also thanks to Analytics Platform team (Bo Sun) for the amazing visualization, Logging Platform team for providing real-time data ingestion, and Data Science team (Brian Karfunkel) for statistical consultancy!

You may also like

Meet the Flink Forward Program Committee: A Q&A with Lorenzo Affetti
Meet Lorenzo Affetti, a Program Committee member for Flink Forward 2025, ...

Outrun Fraudsters with Agentic AI and Ververica
Enhance fraud detection with agentic AI and Ververica's real-time stream ...

KartShoppe: Real-Time Feature Engineering With Ververica
Discover how KartShoppe leverages Ververica’s real-time feature engineeri...

Maximize Efficiency: How Ververica's BYOC Deployment Optimizes CAPEX and OPEX
Learn how Ververica's BYOC deployment leverages CAPEX and OPEX to optimiz...


