How To Size Your Apache Flink Cluster Back-of-the-Envelope Calculation
A favorite session from Flink Forward Berlin 2017 was Robert Metzger's "Keep It Going: How to Reliably and Efficiently Operate Apache Flink". One of the topics that Robert touches on is how to roughly size an Apache Flink cluster. Flink Forward attendees mentioned that his cluster sizing guidelines were helpful to them, and so we've converted that section of his talk into a blog post. Enjoy!
One of the most frequently-asked questions in the Flink community is how to size a cluster when moving from development to production. The definitive answer to this question, is, of course, "it depends," but that’s not a helpful answer. This post outlines a series of questions to ask to arrive at some numbers you can use as guidance.
Do the Math and Establish a Baseline
The first step is to think through your application’s operational metrics to arrive at a baseline of required resources.
The key metrics to consider are:
-
The number of records per second and the size per record
-
The number of distinct keys you have and the state size per key
-
The number of state updates and the access patterns of your state backend
Finally, a more pragmatic concern is your service-level agreements (SLAs) around downtime, latency, and max throughput with your customers as these directly influence your capacity planning.
Next, look at what resources you have available based on your budget. For example:
-
The network capacity, taking into account any external services that also use the network, such as Kafka, HDFS, etc.
-
Your disk bandwidth, if you are relying on a disk-based state backend like RocksDB (and considering other disk use like Kafka or HDFS)
-
The number of machines and the CPU and memory they have available
Based on all these factors, you can now build a baseline for normal operation, plus a buffer of resources used for recovery catch-up or to handle load spikes. I recommend you also consider the resources used during checkpointing when establishing the baseline.
Example: Let’s run some numbers
I will now plan a job deployment on a hypothetical cluster to visualize the process of establishing a resource usage baseline. These numbers are rough “back-of-the-envelope” values, and they’re not comprehensive--at the end of the post, I’ll also identify some of the aspects that I ignored while making this calculation.
Example Flink Streaming Job and Hardware
 Example Flink Streaming job topology
For this example, I am going to deploy a typical Flink streaming job that reads data from a Kafka topic using Flink’s Kafka consumer. The stream is then transformed using a keyed, aggregating window operator. The window operator performs aggregations on time windows of 5 minutes. As there is always fresh data, I’ll configure the window to be a sliding window with a 1-minute slide.
This means I’ll get the aggregates for the past 5 minutes updated every minute. The streaming job creates an aggregate per userId. The messages consumed from the Kafka topic have a size (on average) of 2 KB.
The throughput is 1 million messages per second. To understand the state size of the window operator, you need to know the number of distinct keys. In this case, it’s the number of userId's, which is 500,000,000 unique users. For each user, you are computing four numbers, stored as longs (8 bytes).
Let’s summarize the job’s key metrics:
-
Message size: 2KB
-
Throughput: 1,000,000 msg/sec
-
Distinct keys: 500,000,000 (aggregation in window: 4 longs per key)
-
Checkpointing: Once every minute.
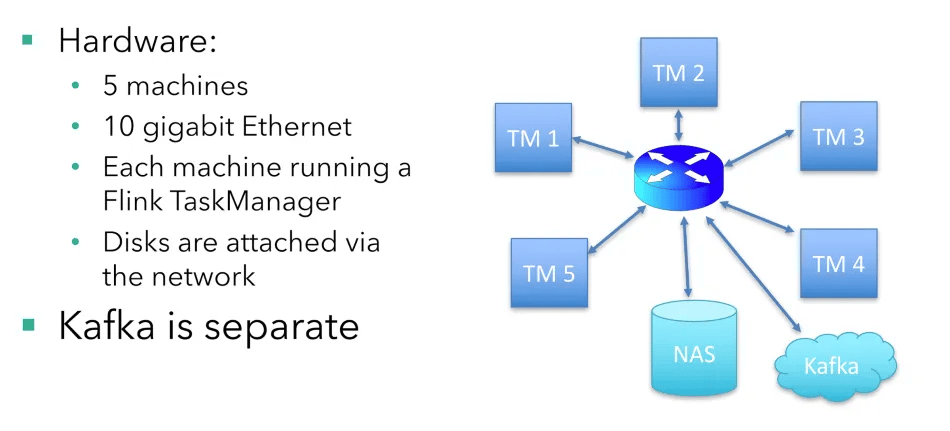 Hypothetical Hardware Setup
There are five machines running the job, each running a Flink TaskManager (Flink’s worker nodes). Disks are network-attached (common in cloud setups), and there is a 10 Gigabit Ethernet connection from the main switch to each machine running a TaskManager. The Kafka brokers are running on separate machines.
Each machine has 16 CPU cores. For simplicity, I won’t consider CPU and memory requirements. In the real world, depending on your application logic and the state backend in use, you would need to pay attention to memory. This example uses a RocksDB-based state backend, which is robust and has low memory requirements.
A Single Machine’s Perspective
To understand the resource requirements of the whole job deployment, it’s easiest to focus on the operations in one machine and one TaskManager first. You can then use the numbers derived from one machine to calculate the overall resource requirements.
By default (if all operators have the same parallelism and there are no special scheduling restrictions), all operators of a streaming job are running on each machine.
In this case, the Kafka source (or consumer), window operator, and Kafka sink (or producer) are all running on each of the five machines.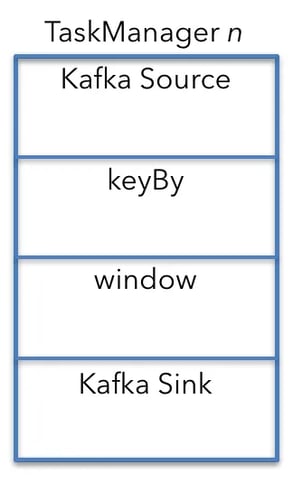 A machine perspective - TaskManager n keyBy is a separate operator in the figure above so that calculating the resource requirements is easier. In reality, keyBy is an API construct and translates into a configuration attribute for the connection between the Kafka source and window operator.
I will now go through each of these operators from top to bottom to understand their network resource requirements.
The Kafka source
To calculate the amount of data received by an individual Kafka source, first, compute the aggregate Kafka input. The sources receive 1,000,000 messages per second that are 2KB each.
2KB x 1,000,000/s = 2GB/s
Dividing 2GB/s by the number of machines (5) leads to the following result:
2GB/s ÷ 5 machines = 400MB/s
Each of the 5 Kafka sources running in the cluster receives data with an average throughput of 400 MB/s.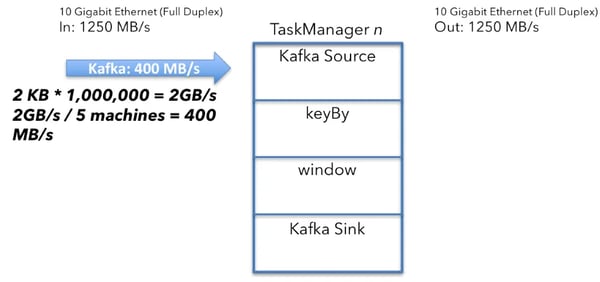 The Kafka source calculation
The Shuffle / keyBy
Next, you need to ensure that all events with the same key (in this case the userId) end up on the same machine. The data in the Kafka topic you are reading from might be partitioned according to a different partitioning scheme.
The shuffling process sends all data with the same key to one machine, so you are splitting the 400MB/s stream of data coming from Kafka into a userId-partitioned stream:
400MB/s ÷ 5 machines = 80MB/s
On average, you have to send 80 MB/s of data to each of the machines. This analysis is from the perspective of a single machine which means that some of the data is already on the designated target machine, so subtract 80MB/s to account for that:
400MB/s - 80MB = 320MB/s
Each machine receives and sends user data at a rate of 320MB/s.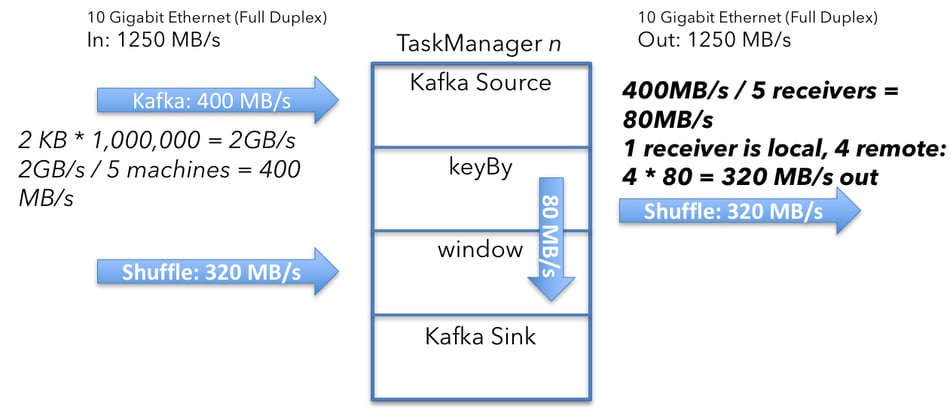 The shuffle calculation
Window Emit and Kafka Sink
The next question to ask is how much data the window operator emits and sends through to the Kafka sink. It’s 67MB/s, and let's explain how we arrived at this number.
The window operator keeps an aggregate of 4 numbers (represented as longs) for each key. Once every minute, the operator emits the current aggregate values. Each key emits 2 ints (user_id, window_ts) and 4 longs from the aggregation:
(2 x 4 bytes) + (4 x 8 bytes) = 40 bytes per key
Then factor in the keys (500,000,000 divided by the number of machines):
100,000,000 keys x 40 bytes = 4GB
...from each machine.
Then calculate the per-second size:
4GB/min ÷ 60 = 67MB/s
...emitted by each TaskManager.
This means that each TaskManager emits on average 67 MB/s of user data from the window operators. Since there is a Kafka sink running on each TaskManager (next to the window operator), and there’s no further repartitioning, this is the amount of data emitted from Flink to Kafka.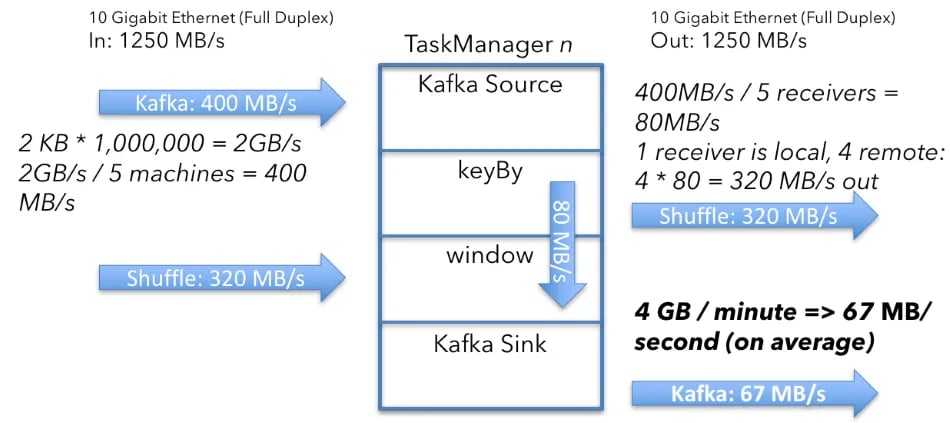
User data: From Kafka, shuffled to the window operators and back to Kafka
The emission of data from the window operators is expected to be “bursty,” because they are emitting the data once every minute. In practice, the operator will not send data at a constant rate of 67 MB/s, but rather max out the available bandwidth for a few seconds every minute.
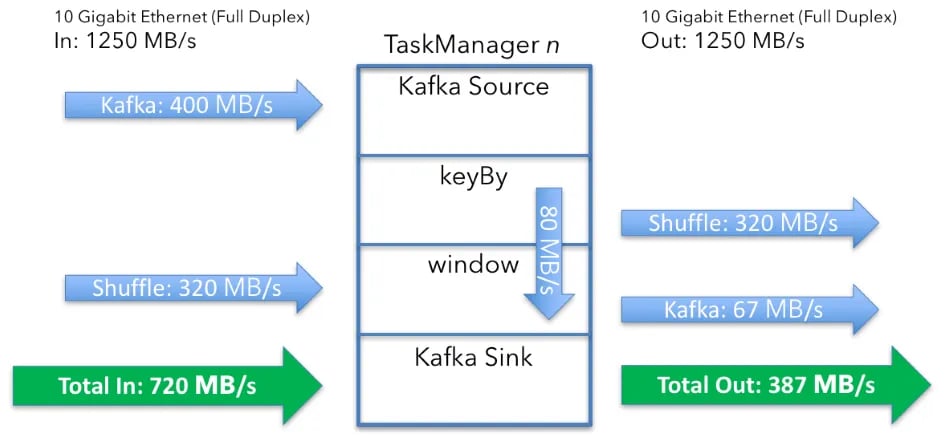
This all totals to:
-
Data in: 720MB/s (400 + 320) per machine
-
Data out: 387MB/s (320 + 67) per machine
State Access and Checkpointing
That’s not everything. So far, I’ve only looked at the user data that Flink is processing. You need to include the overhead from disk access to RocksDB for storing state and checkpointing. To understand the disk access costs, you look at how the window operator accesses state. The Kafka source also keeps some state, but it is negligible compared to the window operator.
To understand the state size of the window operator, look at it from a different angle. Flink is computing five-minute windows with a 1-minute slide. Flink implements sliding windows by maintaining five windows, one for each “slide.” As mentioned earlier, you maintain 40 bytes of state for each window and each key for the aggregations when using a window implementation which is performing an eager aggregation. For every incoming event, you first need to retrieve the current aggregation values from disk (read 40 bytes), update the aggregates, and then write the new value back (write 40 bytes).

Window State
This means:
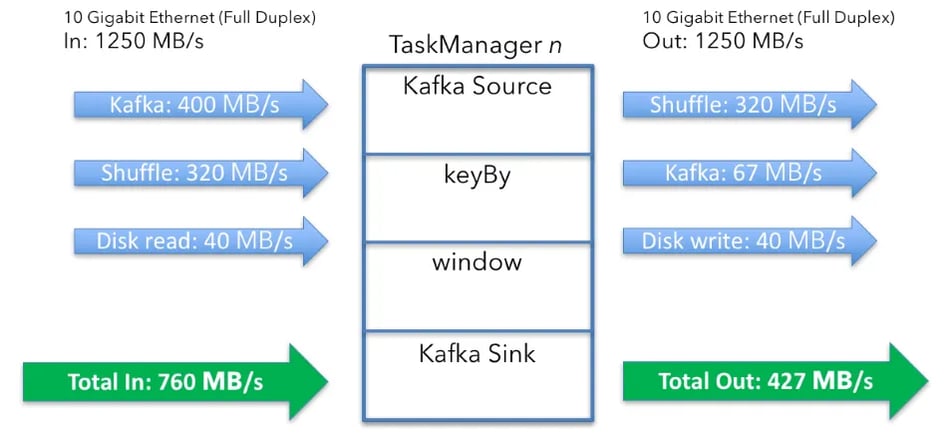
40 bytes of state x 5 windows x 200,000 msg/s per machine = 40MB/s
...of read or write disk access per machine. As said in the beginning, the disks are network attached, so I need to add these numbers to the overall throughput calculations.The totals are now:
-
Data in: 760MB/s (400 MB/s data in + 320 MB/s shuffle + 40 MB/s state)
-
Data out: 427MB/s (320 MB/s shuffle + 67 MB/s data out + 40 MB/s state)
 The above considerations are for the state access, which happens consistently as new events arrive at the window operator. You also have checkpointing enabled for fault-tolerance. If a machine or anything else fails, you want to restore your window contents and continue processing.
Checkpointing is set to an interval of one checkpoint per minute, and each checkpoint copies the entire state of the job into a network-attached file system.
Let’s quickly see how big the entire state on each machine is:
40bytes of state x 5 windows x 100,000,000 keys = 20GB
And, to get the per-second value:
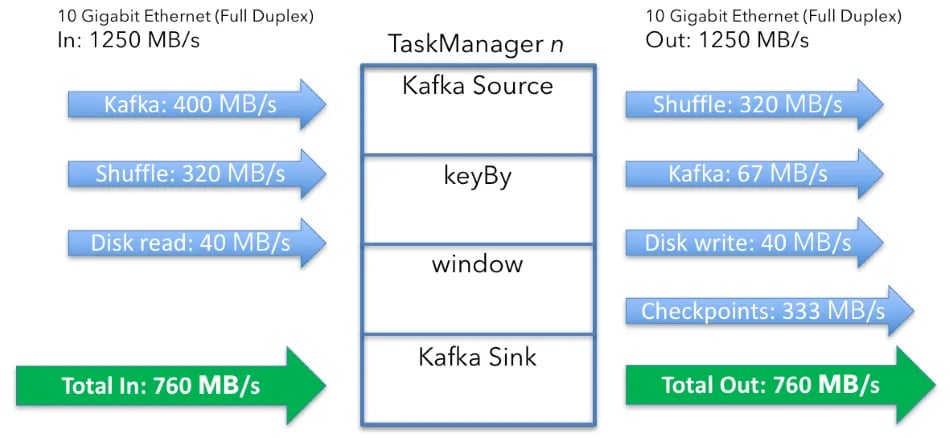
20GB ÷ 60 = 333 MB/s.
Similar to the window operator, checkpointing has a bursty pattern, and once every minute, it tries to send its data at full speed to external storage. Checkpointing causes additional state access to RocksDB (which in this example is located on network attached disks). Since Flink 1.3, the RocksDB state backend supports incremental checkpointing, reducing the required network transfers on each checkpoint, by conceptually only sending the “diff” since the last checkpoint, but this feature is not used in this example.
This updates the totals to:
-
Data in: 760MB/s (400 + 320 + 40)
-
Data out: 760MB/s (320 + 67 + 40 + 333)
 This means that the overall network traffic is:
760 + 760 x 5 + 400 + 2335 = 10335 MB/s
The 400 is total of the 80MB state access (read and write) process across the 5 machines, and 2335 is the total of the Kafka in and out processes across the cluster.
Or just over half the available network capacity in the hardware setup above.
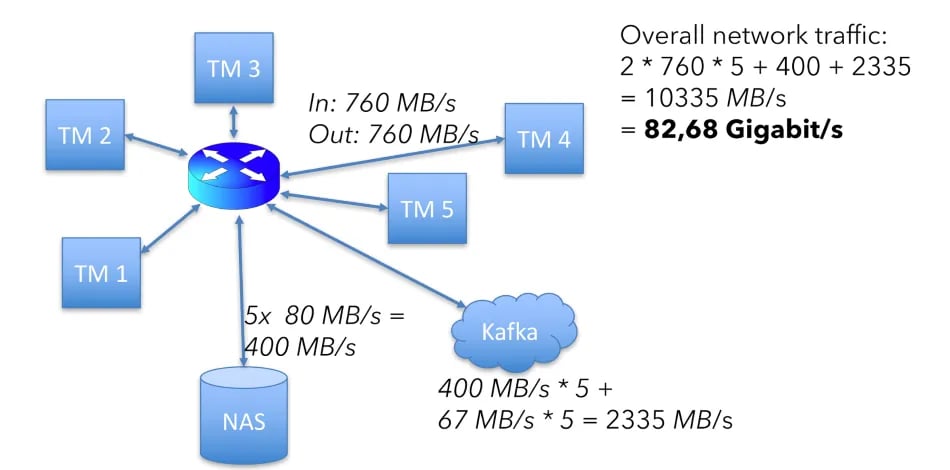 Networking requirements
There’s a disclaimer I’d like to add. None of these calculations include protocol overhead such as TCP, Ethernet, and RPC calls from Flink, Kafka, or the file system. This is still good starting point to understand what sort of hardware you will need for a job and to have an indication of performance.
Scale Your Way
Based on my analysis, this example, with a 5-node cluster, and in typical operation, each machine would need to handle 760 MB/s of data, both in and out, from a total capacity of 1250 MB/s. That reserves about 40% of the network capacity for the complexities I glossed over, such as network protocol overheads, heavy load during event replay when recovering from a checkpoint, and uneven load balancing across the cluster caused by data skew.
There’s no one-size-fits-all answer to whether 40% is an appropriate amount of headroom, but this arithmetic should give you a good starting point. Try the calculations above, swapping out the number of machines, the number of keys, or the messages per second to get a selection of values to consider and then balance that with your budget and operational factors. Happy scaling!

You may also like

Meet the Flink Forward Program Committee: A Q&A with Lorenzo Affetti
Meet Lorenzo Affetti, a Program Committee member for Flink Forward 2025, ...

Outrun Fraudsters with Agentic AI and Ververica
Enhance fraud detection with agentic AI and Ververica's real-time stream ...

KartShoppe: Real-Time Feature Engineering With Ververica
Discover how KartShoppe leverages Ververica’s real-time feature engineeri...

Maximize Efficiency: How Ververica's BYOC Deployment Optimizes CAPEX and OPEX
Learn how Ververica's BYOC deployment leverages CAPEX and OPEX to optimiz...


