High-throughput, low-latency, and exactly-once stream processing
The popularity of stream data platforms is skyrocketing. Several companies are transitioning parts of their data infrastructure to a streaming paradigm as a solution to increasing demands for real-time access to information. Infrastructures based on streaming data not only enable new types of latency-critical applications and give more actual operational insights through more up-to-date views of the processes; they also have the potential to make classical data warehousing setups radically more simple and flexible the same time.
A crucial piece of a streaming infrastructure is a stream processor that can deliver high throughput across a wide spectrum of latencies and strong consistency guarantees even in the presence of stateful computations. In recent articles, we introduced Apache Flink™ as a scalable stream processing engine that provides exactly this combination of properties.
In this article, we dig in deeper into how Flink's novel checkpointing mechanism works, and how it supersedes older architectures for streaming fault tolerance and recovery. We measure the performance of Flink for various types of streaming applications and put it into perspective by running the same series of experiments on Apache Storm, a widely used low-latency stream processor.
An Evolution of Streaming Architectures
Guaranteeing fault-tolerant and performant stream processing is hard. In batch processing, when a job fails, one can simply re-run the failed parts of the job to re-create the lost results. This is possible in batch processing, as a file can be replayed from the beginning to the end. The same is not true in continuous stream processing. A data stream does not have, in principle, a beginning and an end. A buffered stream can be replayed, but replaying from the beginning of time is impractical (a streaming job can run for months). Also, streaming computation is stateful, in contrast to batch jobs that have only inputs and outputs. This means that the system needs to backup and recover operator state in addition to outputs. Due to the complexity of the problem, there are many approaches to fault tolerance in the open source ecosystem.
The mechanisms used for fault tolerance also have deep implications to the architecture of the whole framework that reach as far as the programming model offered. It is not easy to plug in a different fault tolerance mechanism into an existing framework. Thus, the basic paradigm for fault tolerance is crucial when choosing a stream processing framework.
We discuss several approaches of fault-tolerant streaming architectures, starting from record acknowledgements to micro-batching, transactional updates, and distributed snapshots. We eventually want to arrive at a certain mix of desiderata that stem from streaming applications. These are the following:
-
Exactly-once guarantees: state in stateful operators should be correctly restored after a failure
-
Low latency: the lower the better. Many applications require sub-second latency
-
High throughput: pushing large amounts of data through the pipeline is crucial as the data rates grow
-
Powerful computation model: the framework should offer a programming model that does not restrict the user and allows a wide variety of applications
-
Low overhead of the fault tolerance mechanism in the absence of failures
-
Flow control: backpressure from slow operators should be naturally absorbed by the system and the data sources to avoid crashes or degrading performance due to slow consumers
We leave out a common trait, namely fast recovery after a failure, not because it is not important, but because (1) all the introduced systems are able to recover using the full parallel infrastructure, and (2) in stateful applications, the recovery of the state from reliable storage and not the framework is usually the bottleneck.
Record acknowledgements (Apache Storm)
While stream processing has been widely used in industries such as finance for years, it is recently becoming part of the data infrastructure of a much wider array of use cases. The availability of open source frameworks has been pushing this adoption. Perhaps the first widely used large-scale stream processing framework in the open source world was Apache Storm. Storm uses a mechanism of upstream backup and record acknowledgements to guarantee that messages are re-processed after a failure. Note that Storm does not guarantee state consistency, any mutable state handling is delegated to the user (Storm’s Trident API does guarantee state consistency and is described in the next section).
Acknowledgements work as follows: each record that is processed from an operator sends back to the previous operator an acknowledgement that it has been processed. The source of the topology keeps a backup of all the tuples it generates. Once a source record has received acknowledgements from all generated records until the sinks, it can safely be discarded from the upstream backup. At failure, if not all acknowledgements have been received, then the source record is replayed. This guarantees no data loss, but does result in duplicate records passing through the system (hence the term “at least once”). Storm implements this scheme with a clever mechanism that only requires few bytes storage per source record to track the acknowledgements. Twitter Heron maintains the same acknowledgement mechanism as Storm but improves on the efficiency of record replay (and thus recovery time and overall throughput).
Pure record acknowledgement architectures, regardless of their performance, fail in offering exactly once guarantees, this burdening the application developer with deduplication. This may be acceptable for some applications, but is not for many others. Other problems with Storm’s mechanism is low throughput and problems with flow control, as the acknowledgment mechanism often falsely classifies failures under backpressure. This led to the next evolution of streaming architectures, based on micro-batching.
Micro batches (Apache Storm Trident, Apache Spark Streaming)
Storm and prior streaming systems do not deliver some of the requirements that were essential for large-scale applications, in particular high throughput, fast parallel recovery, and exactly-once semantics for managed state.
The next evolution in fault tolerant streaming architectures was the idea of micro-batching or stream discretization. The idea is very simple: in order to overcome the complexity and overhead of record-level synchronization that comes with the model of continuous operators that process and buffer records, a continuous computation is broken down in a series of small, atomic batch jobs (called micro-batches). Each micro-batch may either succeed or fail. At a failure, the latest micro-batch can be simply recomputed.
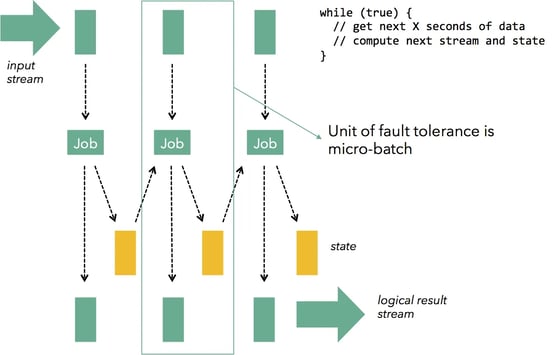
Micro-batching is a technique that can be applied on top of an existing engine that is capable of dataflow computations. For example, micro-batching can be applied on top of a batch engine (e.g., Spark) to provide streaming capabilities (this is the basic mechanism behind Spark Streaming), and it can also be applied on top of a streaming engine (e.g., Storm) to provide exactly-once guarantees and state recovery (this is the idea behind Storm Trident). In Spark Streaming, each micro-batch computation is a Spark job, and in Trident, each micro-batch is a large record into which all records from the micro-batch are collapsed.
Systems based on micro-batching can achieve quite a few of the desiderata outlined above (exactly-once guarantees, high throughput), but they leave much to be desired:
-
Programming model: to achieve its goals, Spark Streaming, for example, changes the programming model from streaming to micro-batching. This means that users can no longer window data in periods other than multiples of the checkpoint interval, and the model cannot support count-based or session windows needed by many applications. These are left as concerns for the application developer. The pure streaming model with continuous operators that can mutate state provides more flexibility for users.
-
Flow control: Micro-batch architectures that use time-based batches have an inherent problem with backpressure effects. If processing of a micro-batch takes longer in downstream operations (e.g., due to a compute-intensive operator, or a slow sink) than in the batching operator (typically the source), the micro batch will take longer than configured. This leads either to more and more batches queueing up, or to a growing micro-batch size.
-
Latency: Micro-batching obviously limits the latency of jobs to that of the micro-batch. While sub-second batch latency is feasible for simple applications, applications with multiple network shuffles easily bring the latency up to multiple seconds.
Perhaps the largest limitation of the micro-batch model is that it connects two notions that should not be connected: the application-defined window size and the system-internal recovery interval. Assume a program (below is sample Flink code) that aggregates records every 5 seconds:
dataStream

    .map(transformRecords)

    .groupBy(“sessionId”)

    .window(Time.of(5, TimeUnit.SECONDS))

    .sum(“price”)
Such applications fit well to the micro-batch model. The system accumulates 5 seconds worth of data, sums them up, and emits the aggregate after doing some transformations on the stream. Downstream applications can consume the 5 second-aggregates to, e.g., display on a dashboard. However, assume now that a backpressure effect starts to kick in (due, e.g., to a compute-intensive transformRecords function), or that the DevOps teams decide to control the job’s throughput by increasing the interval to 10 seconds. Then, the micro-batch size changes dynamically either uncontrollably (in the case of backpressure), or to 10 seconds (in the second case). This means that the aggregates consumed by downstream applications (e.g., a web dashboard that contains the text “Last 5-second sum”) become wrong, or that downstream applications need to deal with this problem themselves.
Micro-batching can achieve high throughput and exactly-once guarantees, but current implementations give away low latency, flow control, and the pure streaming programming model to achieve those. The obvious question is whether it is possible to get the best of both worlds: keep all benefits of the continuous operator model while guaranteeing exactly once semantics and providing high throughput. Later streaming architectures, discussed below, achieve exactly this combination and subsume micro-batching as the fundamental model for streaming.
Note: Often, micro-batching is thought of as an alternative to record-at-a-time processing. This is a false dilemma: continuous operators do not need to process one record at a time. In fact, all well-designed streaming systems (including Flink and Google Dataflow discussed below) buffer many records before shipping them over the network, while having continuous operators.
Transactional updates (Google Cloud Dataflow)
A clean and powerful way to guarantee exactly once processing while keeping the benefits of the continuous operator model (low latency, backpressure tolerance, mutable state, etc) is to atomically log record deliveries together with updates to the state. Upon failure, state and record deliveries are repeated from the log.
This concept is implemented, for example, in Google Cloud Dataflow. The system models computation as a DAG of continuous operators that are deployed once and are long-running. In Dataflow, shuffles are streamed and results do not need to materialize. This gives low latency a natural flow control mechanism as intermediate buffers mitigate backpressure until it reaches the sources (and pull-based sources such as Kafka consumers can deal with this problem). This model also provides a clean streaming programming model that can support richer windows than simple time-based windows as well as updates to long-standing mutable state. It is worth noting that the streaming programming model subsumes the micro-batch model.
For example, the following Google Cloud Dataflow program (see here) creates a session window that triggers if no events for a key arrive within 10 minutes. Data that arrives after the 10-minute gap will initiate a new window.
PCollection<String> items = ...;

PCollection<String> session_windowed_items = items.apply(

    Window.<String>into(Sessions.withGapDuration(Duration.standardMinutes(10))))
This is straightforward to implement in the streaming model, but difficult in the micro-batch model, as the window does not correspond to a fixed micro-batch size.
Fault tolerance in such an architecture works as follows. Each intermediate record that passes through an operator, together with the state updates and derived records generated, creates a commit record that is atomically appended to a transactional log or inserted into a database. In the case of failure, part of the database log is replayed to consistently restore the state of the computation, as well as replay the records that were lost.
Apache Samza follows a similar approach, but can only deliver at least once guarantees, as it uses Apache Kafka as a background store. Kafka does not (as of now) provide a transactional writer, so updates to the state and derived stream records cannot be committed together as an atomic transaction.
The transactional updates architecture has many advantages. In fact, it achieves all the desiderata that we put forth at the beginning of this post. Fundamental to this architecture is the ability to write frequently to a distributed fault-tolerant store with high throughput. Distributed snapshots, explained in the next sections, snapshot the state of a topology as a whole, thereby reducing the amount and frequency of writes to the distributed store.
Distributed Snapshots (Apache Flink™)
The problem of providing exactly once guarantees really boils down to determining what state the streaming computation currently is in (including in-flight records, and operator state), drawing a consistent snapshot of that state, and storing that snapshot in durable storage. If one can do this frequently, recovery from a failure only means restoring the latest snapshot from durable storage, rewinding the stream source (for example with help of Apache Kafka) to the point when the snapshot was taken and hitting the play button again. Flink's algorithm is described in this paper; in the following, we give a brief summary.
Flink's snapshot algorithm is based on a technique introduced in 1985 by Chandy and Lamport, to draw consistent snapshots of the current state of a distributed system (see a good introduction here) without missing information and without recording duplicates. Flink's variation of the Chandy Lamport algorithm periodically draws state snapshots of a running stream topology, and stores these snapshots to durable storage (e.g., to HDFS or an in-memory file system). The frequency of these checkpoints is configurable.
This is similar to the micro-batching approach, in which all computations between two checkpoints either succeed or fail atomically as a whole. However, the similarities stop there. One great feature of Chandy Lamport is that we never have to press the “pause” button in stream processing to schedule the next micro batch. Instead, regular data processing always keeps going, processing events as they come, while checkpoints happen in the background. Quoting the original paper,
The global-state-detection algorithm is to be superimposed on the underlying computation: it must run concurrently with, but not alter, this underlying computation.
This architecture thus combines the benefits of following a true continuous operator model (low latency, flow control, and true streaming programming model) with high throughput, and exactly-once guarantees provable by the Chandy-Lamport algorithm. Other than backing up the state of stateful computations (which every other fault tolerance mechanism needs to do as well), this fault tolerance mechanism has virtually no overhead. For small state (e.g., counts or other statistical summaries), this backup overhead is usually negligible, while for large state, the checkpoint interval makes a tradeoff between throughput and recovery time.
Most importantly, this architecture separates application development from flow control and throughput control. Changing the snapshotting interval has absolutely no effect on the results of the streaming job, so downstream applications can safely rely on receiving correct results.
Flink’s checkpointing mechanism is based on stream barriers (think “markers” in Chandy Lamport) that flow through the operators and channels. This description of Flink’s checkpointing is adapted from the Flink documentation.
Barriers are first injected at the sources (e.g., if using Apache Kafka as a source, barriers are aligned with offsets), and flow through the DAG as part of the data stream together with the data records. A barrier separates records into two groups: those that are part of the current snapshot (a barrier signals the start of a checkpoint), and those that are part of the next snapshot.
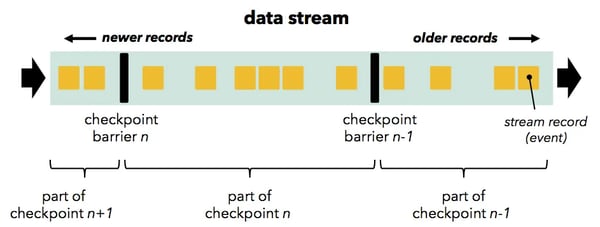
Barriers flow downstream and trigger state snapshots when they pass through operators. An operator first aligns its barriers from all incoming stream partitions (if the operator has more than one input), buffering data from faster partitions. When an operator has received a barrier from every incoming stream, it checkpoints its state (if any) to durable storage. Once state checkpointing is done, the operator forwards the barrier downstream. Note that in this mechanism, state checkpointing can be both asynchronous (processing continues while the state is written) and incremental (only changes are written), if the operator supports that. 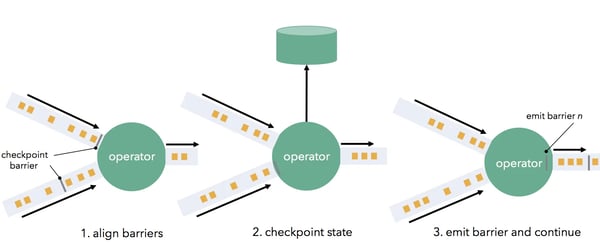
Once all data sinks have received the barriers, the current checkpoint has finished. Recovery on a failure means simply restoring the latest checkpointed state, and restarting the sources from the last recorded barrier. Distributed snapshots score well in all the desiderata we set out to achieve in the beginning of this post. They achieve exactly-once guarantees with high throughput while retaining the continuous operator model and along with it, low latency and natural flow control.
Summary
We started this post with a list of desiderata from distributed streaming architectures. The following table summarizes how each architecture we discussed supports these features.
| Record acks (Storm) | Micro-batching (Spark Streaming, Trident) | Transactional updates (Google Cloud Dataflow) | Distributed snapshots (Flink) | |
| Guarantee | At least once | Exactly once | Exactly once | Exactly once |
| Latency | Very Low | High | Low (delay of transaction) | Very Low |
| Throughput | Low | High | Medium to High (Depends on throughput of distributed transactional store) | High |
| Computation model | Streaming | Micro-batch | Streaming | Streaming |
| Overhead of fault tolerance mechanism | High | Low | Depends on throughput of distributed transactional store | Low |
| Flow control | Problematic | Problematic | Natural | Natural |
| Separation of application logic from fault tolerance | Partially (timeouts matter) | No (micro batch size affects semantics) | Yes | Yes |
Show me the numbers
To shed some light on the performance of Apache Flink™, we run a series of experiments where we investigate throughput, latency, and the impact of the fault tolerance mechanism. All experiments were conducted on Google Compute Engine, using 30 instances with 4 cores and 15 GB of memory each. All Flink experiments were performed with the latest code revision as of July, 24th, all Storm experiments with version 0.9.3. All the code used for the evaluation can be found here.
To provide a frame of reference, we also show the results when running the same applications on top of Apache Storm, one of the most widely used streaming systems, which implements both “record acknowledgements”, as well as the “mini-batches” (via the Trident library).
Throughput
We measure the throughput of Flink and Storm for two different programs in a 30-node cluster of a total of 120 cores. The first program is a parallel streaming grep task, which searches the stream for events that contain a string matching a regular expression. The grep application is embarrassingly parallel and scales trivially across the partitioned streams. 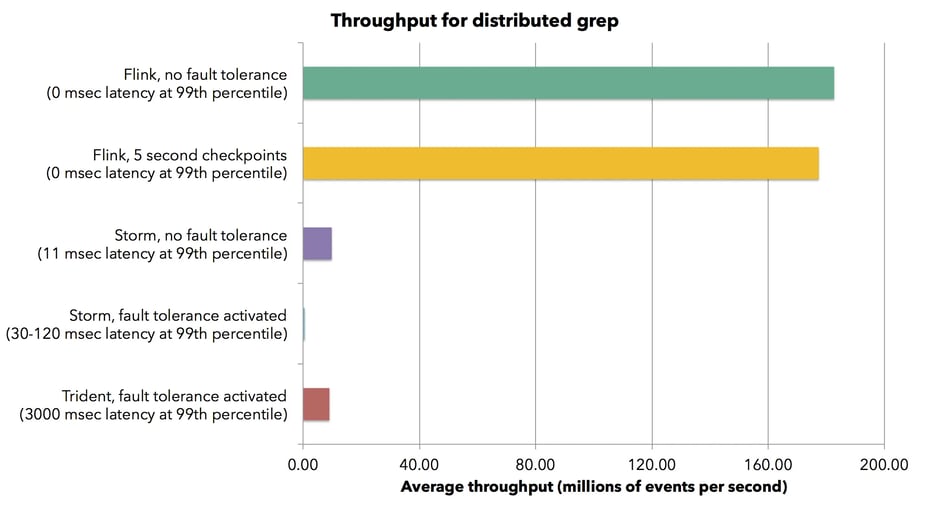 Flink achieves a sustained throughput of 1.5 million elements per second per core for the grep job. This brings the aggregate throughput in the cluster to 182 million elements per second. The measured latency for Flink is zero, as the job does not involve network and no micro-batching is involved. When turning on Flink’s fault tolerance mechanism by taking a checkpoint every 5 seconds we only see a very slight degradation (less than 2%) in throughput. Fault tolerance does not introduce any latency.
Storm with acknowledgments turned off (and thus without any delivery guarantees) achieves a throughput of about 82,000 elements per second per core with latency of about 10 milliseconds in the 99-th percentile. The aggregate throughput for the whole cluster is 0.57 million elements per second. When turning acknowledgments on (guaranteeing at least one delivery), Storm’s throughput falls to 4,700 elements per second per core, and Storm’s latency also increases to 30-120 milliseconds. Next, we configured Storm Trident with a micro-batch size of 200,000 tuples. Trident achieves a throughput of 75,000 elements per second per core (bringing the aggregate throughput to roughly the same level as that of Storm with fault tolerance turned off). However, this comes at a cost of a latency of 3000 milliseconds (in the 99th percentile).
We see that Flink achieves more than 20 times higher throughput than Trident and 300 times higher throughput than Storm. It does so while maintaining latency to (measurably) zero. We also see that by avoiding micro-batches, the high throughput does not come at the cost of latency. Flink also chains the source and the sink tasks, thereby only exchanging handles of records within a single JVM.
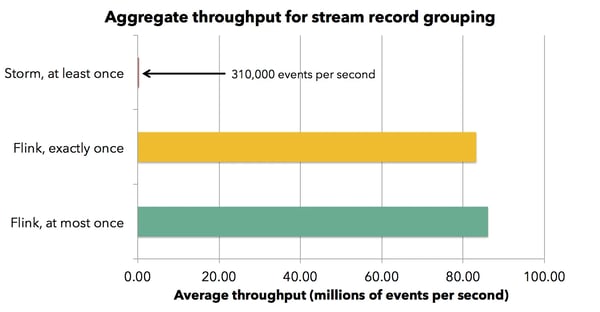
We also performed this experiment scaling the number of cores from 40 to 120. All frameworks scale linearly, which is expected as grep is an embarrassingly parallel job. Let us now look at a different job, which performs a stream grouping by key, thereby shuffling the stream through the network. We run this job in a cluster of 30 machines with the same system configuration as before. Flink achieves a throughput of about 720,000 events per second per core, falling to 690,000 with checkpointing activated. Note that Flink backs up the state of operators with every checkpoint, while Storm does not support that. The state in this example is comparatively small (counts and summaries, amounting to less than a megabyte per operator per checkpoint). Storm with at least once guarantees has throughput of about 2,600 events per second per core.
Latency
Being able to process lots of events is great. The other side, which is especially important in stream processing is latency. For applications like fraud detection or IT security, reacting to event patterns in milliseconds means problems can be prevented, while latencies above 100s of milliseconds often mean that problems can only be detected in hindsight, which is much less valuable.
When application developers expect a certain latency, they often need a latency bound. We measure several latency bounds for the stream record grouping job which shuffles data over the network. The following figure shows the median latency observed, as well as the 90-th, 95-th, and 99-th percentiles (a 99-th percentile of latency of 50 milliseconds, for example, means that 99% of the elements arrive at the end of the pipeline in less than 50 milliseconds).
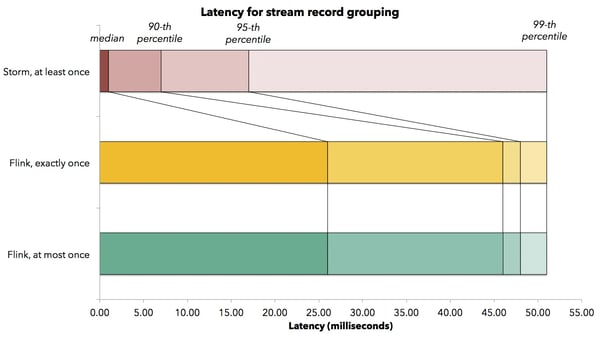
While operating at max throughput, Flink achieves a median latency of 26 milliseconds, and a 99-th percentile latency of 51 milliseconds, meaning that 99% of all latencies were below 51 milliseconds. Turning Flink’s checkpointing mechanism on (thereby activating exactly-once state update guarantees) did not increase the observable latency. We did see latency increases in higher percentiles, with observed latencies in the order of 150 milliseconds. These are attributed to stream alignment latencies, where operators wait to receive the barriers from all their inputs. Storm has a very low median latency (1 millisecond), and a 99-th percentile latency of 51 milliseconds as well.
What is interesting for most applications is the ability to sustain a high throughput across the latency spectrum, depending on the latency requirement of the specific application. In Flink, users can use a knob called the buffer timeout to navigate this spectrum. What does this mean? Flink operators collect records in buffers before sending them to the next operator. By specifying a buffer timeout of, say 10 milliseconds, we can tell Flink to ship a buffer when it is full, or when 10 milliseconds have passed. A lower buffer timeout will typically result in lower latency, possibly at the expense of throughput. In the experiments above, the buffer timeout was set to 50 milliseconds, which explains why the 99th percentile of records took 50 milliseconds.
Here is how the latency boundaries affect the throughput in Flink. Because a lower latency guarantee inevitably means less buffering, it necessarily comes at a certain throughput cost. The chart below shows the throughput of Flink for different buffer timeouts. The experiment again uses the stream record grouping job.
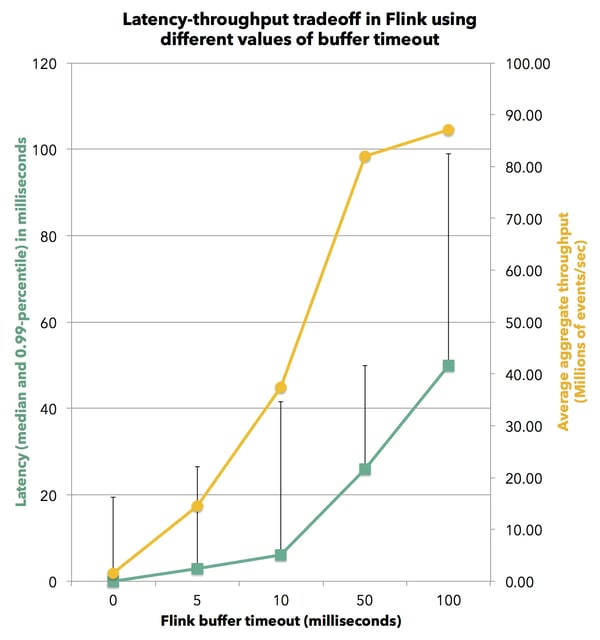 When specifying a buffer timeout of zero, records are immediately forwarded to the network. In this latency-optimized setting, Flink can achieve an observable median latency of 0 milliseconds and a 99-th percentile latency of 20 milliseconds. The corresponding throughput is 24,500 events per second per core. As we increase the buffer timeout, we see an increase in latency with a concurrent increase in throughput, until full throughput is reached where buffers fill up faster than the timeout expiration. At a buffer timeout of 50 milliseconds, the system reaches full throughput of 750,000 events per second per core with a 99-th percentile latency of 50 milliseconds.
Correctness and Recovery Overhead
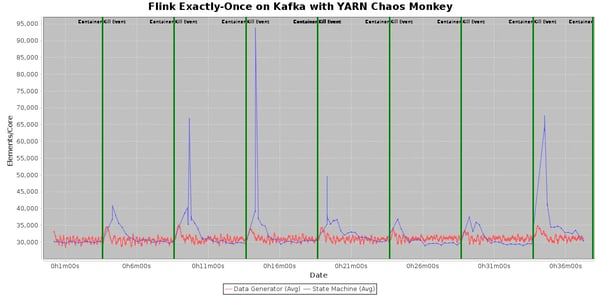
Our last experiment evaluates the correctness of the checkpointing mechanism and the overhead of recoveries. We run a streaming program that requires strong consistency and periodically kill worker nodes.
Our test program is inspired by use cases such as network security/intrusion detection, and uses rules to check the validity of sequences of events (e.g., authentication token, login, service interaction). The program reads the parallel stream of events from Kafka, and groups the events by producing entity (e.g., IP address or user id). For each event, the program checks that the sequence of events for the producing entity so far is valid with respect to the rules (e.g., “service interaction” must be preceded by “login” ). For invalid sequences, the program publishes an alert. Without exactly-once guarantees, failures will inevitably create invalid event sequences and cause the program to publish false alerts.
We run this program in a 30-node cluster, where a “YARN chaos monkey” process kills a random YARN container every 5 minutes. We keep spare workers (TaskManagers), such that the system can continue with full resources immediately after a failure and needs not wait for YARN to provision new containers. Flink will restart the failed workers and add them back to the cluster in the background, to make sure spare workers are always available.
For the purpose of this simulation, we push events to Kafka using a parallel data generator with a speed of roughly 30,000 events per second per core. The following chart shows the rate of the data generator (red line), as well as the throughput of the Flink job that reads the events from Kafka and validates the event sequences using the rules. (blue line).
What’s coming up
At data Artisans, we are working on several features for Flink streaming and aim to make them available soon as part of the next Flink releases, starting with the next Flink 0.10 release.
High availability
Right now, Flink’s master node (called JobManager) is a single point of failure. We are introducing master high-availability with standby master nodes that use Apache Zookeeper for primary/standby coordination.
Event time and watermarks
We are adding to Flink the ability to handle out-of-order events by event time, i.e., the timestamp when a record was created rather instead of the timestamp when it was processed, as well as the notion of watermarks to ensure continuous progress of jobs.
Improved monitoring of running jobs
We are working on a completely reworked monitoring interface that provides a dataflow representation of the job in which users can zoom in at runtime, and observe statistics, such as accumulators. If you are interested in this and want to learn more about Apache Flink™, Google Cloud Dataflow, and other technologies and real-world use cases, sign up for Flink Forward 2015.

You may also like

Meet the Flink Forward Program Committee: A Q&A with Lorenzo Affetti
Meet Lorenzo Affetti, a Program Committee member for Flink Forward 2025, ...

Outrun Fraudsters with Agentic AI and Ververica
Enhance fraud detection with agentic AI and Ververica's real-time stream ...

KartShoppe: Real-Time Feature Engineering With Ververica
Discover how KartShoppe leverages Ververica’s real-time feature engineeri...

Maximize Efficiency: How Ververica's BYOC Deployment Optimizes CAPEX and OPEX
Learn how Ververica's BYOC deployment leverages CAPEX and OPEX to optimiz...


