Data Pipelines with Flink SQL on Ververica Platform
Modern data pipelines require working with data across a number of external systems. Sometimes data lives in a message queue like Apache Kafka, AWS Kinesis, or Apache Pulsar but other times it’s in a traditional database or filesystem. Flink SQL on Ververica Platform ships with a rich collection of table connectors for Flink SQL, making it simple to query, join, and persist data across a number of different systems. In this blog post, I would like to walk you through a simple analytics use case of Flink SQL on Ververica Platform. We will use Flink SQL to read IoT data from an Apache Kafka topic, enrich each record with metadata from a MySQL database, continuously derive statistics, and write these statistics back to ElasticSearch to power a real-time dashboard.
Reading Data From Kafka and MySQL
Flink SQL operates on tables that can be read from and written to. In contrast to a traditional database or data warehouse, Apache Flink does not store the tables itself. Tables are always backed by an external system. One of our previous blog posts demonstrated how to read Avro data from Kafka using the Confluent schema registry. The table, temperature_measurements, contains temperature readings from various IoT sensors around the world.
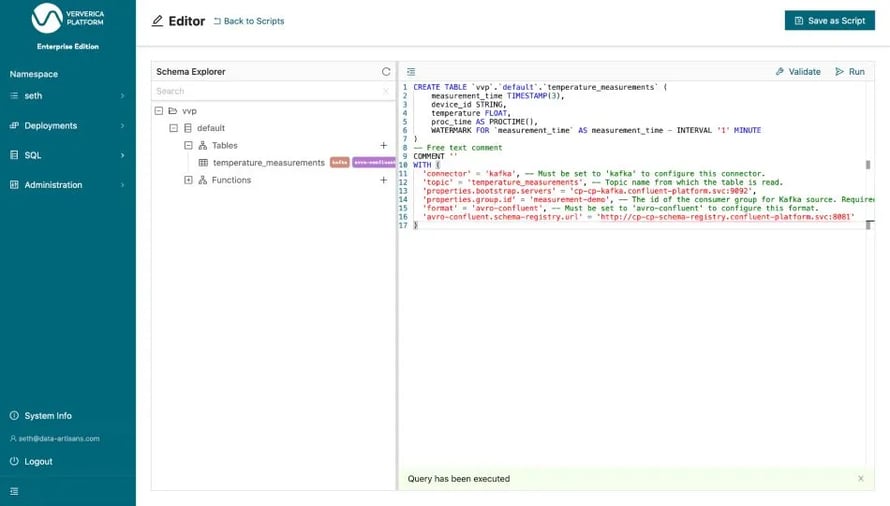 Figure 1: Executing the CREATE TABLE statement for temperature_measurements
Our goal is to calculate the average temperature across all sensors in a particular city per minute. However, sensor measurements do not contain metadata about what city the device is physically located in. This data is available via a table in a MySQL database. We can create a second Flink SQL table to read this metadata.
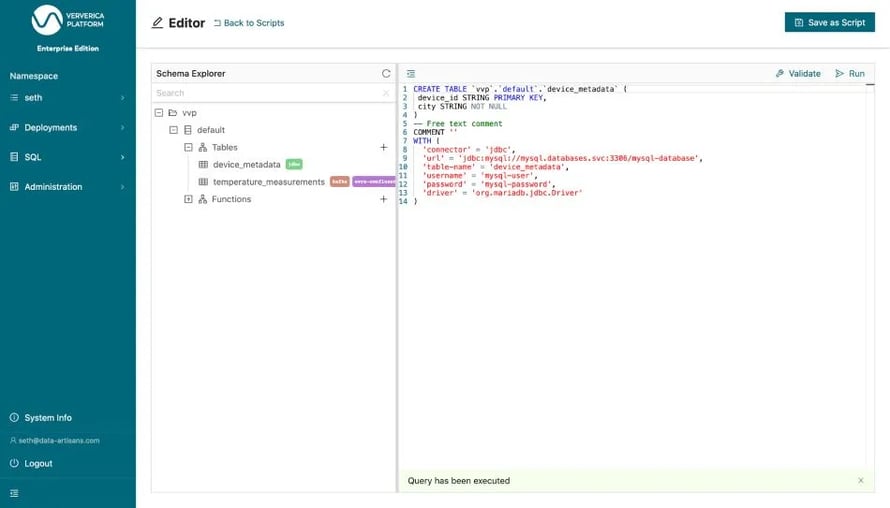 Figure 2: Executing the CREATE TABLE statement for device_metadata
After executing the CREATE TABLE statement, the definition of the device_metadata table is durably stored in the vvp catalog and will be available to other users of that platform namespace going forward as well.
Now, we can query the device_metadata. To start with, let us simply take a look at rows of that MySQL table by running SELECT * FROM device_metadata. Thereby, we are also making sure that the table has been properly configured before building more complicated queries.
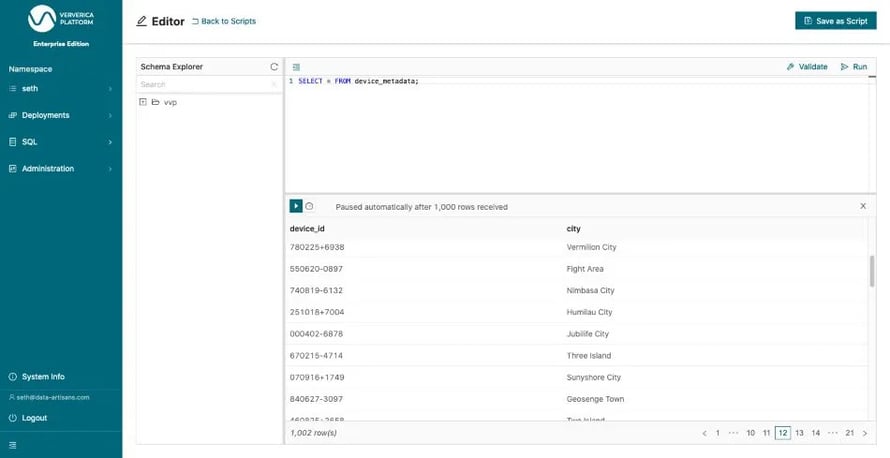 Figure 3: Execute a SELECT query over device_metadata
Developing our Query
Next, we would like to continuously derive statistics about the measurement records, per city, as they arrive. Specifically, we would like to derive the average temperature per minute based on the measurement_time.
Flink SQL can seamlessly join tables across multiple systems, so each measurement record can be joined directly against the MySQL database by device_id to find the corresponding city.
In particular, we will use a Lookup Table Join for enriching a table with data that is queried from an external system.
SELECT
 d.city,
 m.temperature,
 m.measurement_time
FROM temperature_measurements AS m
JOIN device_metadata FOR SYSTEM_TIME AS OF m.proc_time AS d
ON m.device_id = d.device_id
In this query, the temperature_measurements table is enriched with data from the device_metadata table. The FOR SYSTEM_TIME AS OF clause with the subsequent processing time attribute ensures that each row of the measurements table is joined with those device metadata rows that match the join predicate at the point in time when the measurement row is processed by the join operator. It also ensures the join is up to date if the row in the database is modified. This join can be validated using Ververica Platform’s query preview.
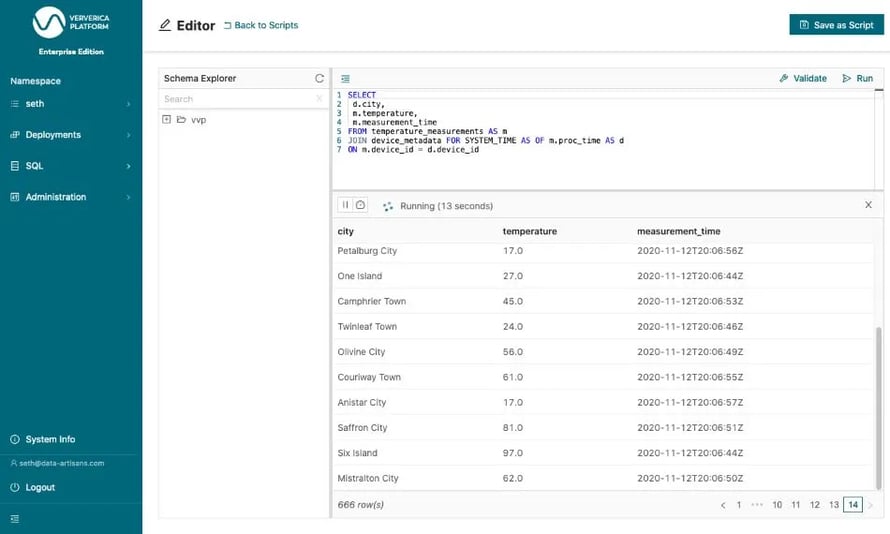 Figure 4: Joining the temperature_measurements table with the device_metadata table
To compute the average temperature per city over one minute windows, we use a so-called GROUP BY window aggregation with a tumbling window. Tumbling windows have a fixed-length and are non-overlapping. We use TUMBLE to group the rows/records, TUMBLE_ROWTIME to extract the timestamp of the window for the final results and AVG to compute the actual average. So, the final statement will look like this:
SELECT
 d.city,
 TUMBLE_ROWTIME(m.measurement_time, INTERVAL '1' MINUTE) AS window_time,
 AVG(m.temperature) AS avg_temperature
FROM temperature_measurements AS m
JOIN device_metadata FOR SYSTEM_TIME AS OF m.proc_time AS d
ON m.device_id = d.device_id
GROUP BY
 d.city,
 TUMBLE(m.measurement_time, INTERVAL '1' MINUTE)
When you run this statement (Figure 4) you will see one result row about every minute because the result rows are only written out once the window end time has passed and the window is closed.
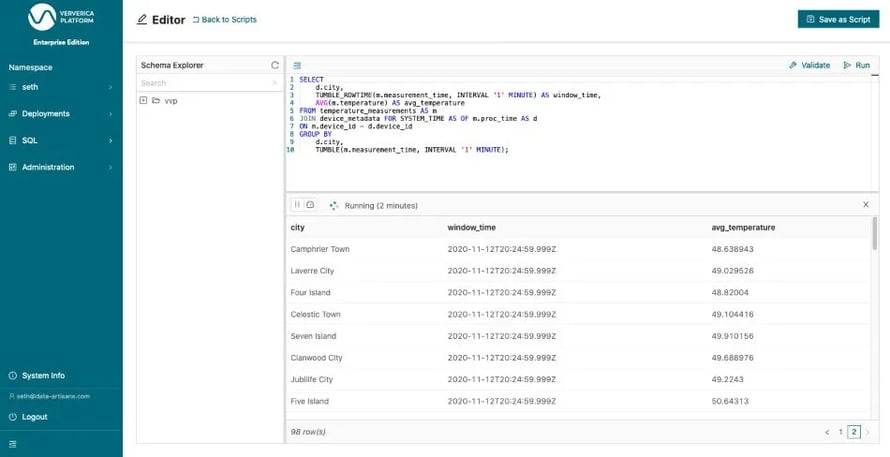 Figure 5: Running our final query from the editor
Writing Out To ElasticSearch
Since we have now established that our query is doing what it should be, we need to write the results into another table. Only by doing so, the results can be consumed by downstream applications. You can also think about it as creating a materialized view based on the temperature_measurement table that is published in ElasticSearch and continuously maintained by Apache Flink. We will call the result table average_temperatures and store it in ElasticSearch so it can be visualized in Kibana and used throughout the organization. Figure 5 shows the corresponding CREATE TABLE statement. Fortunately, the schema and the table name have automatically been templated by the platform based on the INSERT INTO statement underneath it, so that we only need to provide the missing table options like the ElasticSearch host.
%20the%20CREATE%20TABLE%20statement%20for%20the%20result%20table%20average_temperatures.webp?width=890&height=455&name=Executing%20(Run%20Selection)%20the%20CREATE%20TABLE%20statement%20for%20the%20result%20table%20average_temperatures.webp) Figure 6: Executing (“Run Selection”) the CREATE TABLE statement for the result table average_temperatures
Figure 6: Executing (“Run Selection”) the CREATE TABLE statement for the result table average_temperatures
We create avg_temperature as a TEMPORARY TABLE so it is not stored in the catalog. That is because it is only ever used as the output of this one query and we do not need it to be visible to other users of the platform.
Now, we can “Run” the final INSERT INTO statement. As outlined above an INSERT INTO statement reading from an unbounded table is a continuous query, similar to the definition of a materialized view. Therefore, the platform now asks us whether we would like to create a Deployment for this query. A Deployment is Ververica Platform’s abstraction for a long running service or application.
We confirm and finalize the Deployment creation form (Figure 8) by giving the Deployment a name and hitting CREATE SQL Deployment.
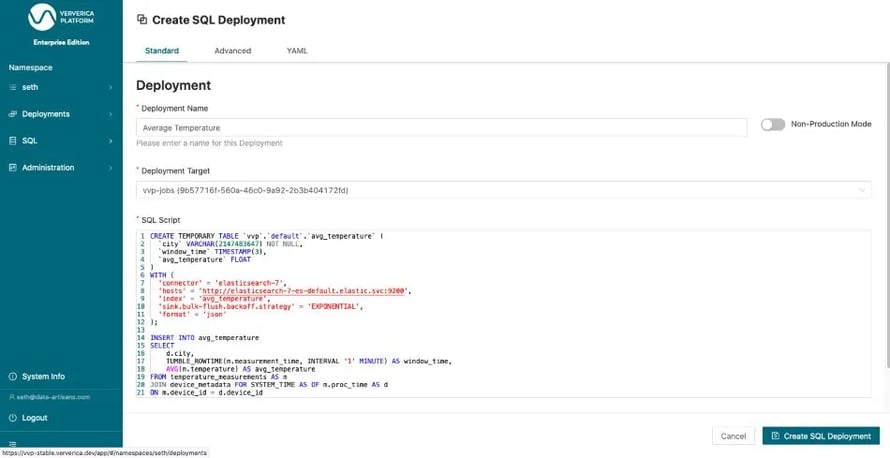 Figure 7: Submitting the query as a long-running Deployment
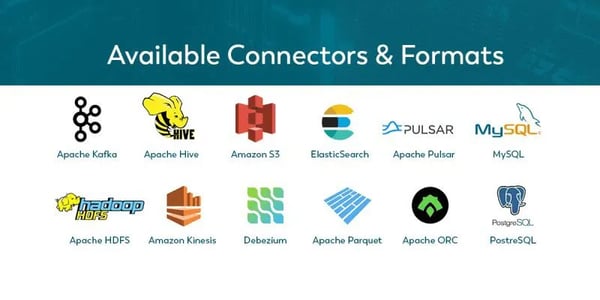
Tight integrations for Apache Kafka, JDBC databases, ElasticSearch, Filesystems, and Apache Hive ship out of the box. Coupled with popular serialization formats such as CSV, JSON, Avro, schema registries, Parquet and more Flink SQL on Ververica Platform makes it simple to work with your data wherever it may be. Upcoming releases will feature first class support for AWS Kinesis, streaming file sources, and pluggable table types and formats for a fully customizable experience.
If you are interested in learning more, I recommend diving in hands-on with our self-contained getting started guide.
You may also like

Zero Trust Theater and Why Most Streaming Platforms Are Pretenders
Most streaming platforms fall short of true Zero Trust and operational re...

No False Trade-Offs: Introducing Ververica Bring Your Own Cloud for Microsoft Azure
Ververica introduces BYOC for Azure, delivering enterprise-grade streamin...

Data Sovereignty Is Existential Most Platforms Treat It Like a Feature
DORA and NIS2 demand provable data sovereignty. Most streaming platforms ...

Dual Pipelines Are Done. Ververica Unifies Batch and Streaming.
Ververica unifies batch and streaming data execution, eliminating pipelin...


